ligo-ex ligo-ds
  Richardson Lab Experimental Log, Page 2 of 13  Not logged in ELOG logo
ID Date Author Type Category Subject
  588   Tue Jun 3 13:08:47 2025 Xuesi MaUpdate  

We currently have the parts for a DB9 connector but need parts for a DB25 connector, where did we get the parts for the DB9 connector? We may be able to use the same company for the DB25 connector.

Also need a cable for the connectors. Find a DB9 to DB9 cable in 1129, not sure if I can disassemble it and use just the cable.

The pressure in the vacuum chamber rises to 2.12e-8 torr, which needs baking.

Attachment 1: 934.jpg
934.jpg
Attachment 2: 933.jpg
933.jpg
  587   Tue Jun 3 12:16:13 2025 Cynthia UpdateInterferometer SimulationsPoint absorber simulation on radially averaged profile
Attachment 1: update_6_3.pdf
update_6_3.pdf
  586   Tue Jun 3 11:54:06 2025 Cece OchoaUpdate CE Cavity Design Update
Update on the design for the CE Cavity Mirrors
Attachment 1: CE_Arm_Cavity_.pdf
CE_Arm_Cavity_.pdf
  585   Tue Jun 3 11:50:08 2025 PooyanUpdateCDSCDS update

There are three major issues with the lab's CDS system that should be addressed. They are ordered from the highest priority to the lowest.

  • CyMAC has stopped serving the fast channels (65k Hz)
    The channels are still there, and the data from the slow (16 Hz) channels is served correctly, but the fast data is not served. As a result, diagggui can not retrieve any information at the moment.
    Probably the issue is the same as the version conflict between daqd and nds2-server. After installing nds2-server on CyMAC and realizing that the conflict can not be resolved, I reverted the changes so that the CyMAC could be compatible with daqd, but there is a chance that there are still version conflicts that block the fast channels.
    I suspect that we have broken the MSC model when adding the new button. This could explain both the fasr-channels fault and the unexpected crashes.

    UPDATE 6/5
    Fixes this by rebuilding the models.
    Note for the future: The c1iop and c1msc models should be rebuilt together, even if no change has been made to c1iop.
  • The fast channels were not saved to the frames
    Reviewing the frame files showed that the daqd was only saving the 16 Hz data in the .gwf frame files. I had missed this because I only checked the existence and the integrity of the raw frame files, but never retrieved the high-frequency data itself to check it.
  • NDS2-server is installed, but does not distribute the data
    I managed to install the nds2-server and its satellite programs on the Chimay, and NFS mount the frame files on it. The server successfully chaches the channel names, frame files, and the data, but fails to list the channels for distribution.

Note: CyMAC machine was strangely disconnected from the network, and required manual reboot. I couldn't find any abnormal logs that could explain what happened.

  584   Mon Jun 2 09:45:06 2025 Luke UpdateScripts/ProgramsRingheater modeling Update

Slides

I have added some slides to my meeting updates. The updates include: my choice in position and width, some figures I have added to my write up, and what I think my immediate steps are to wrap up.

I have also made a new FROSTI model that conducts its raytracing in real time. Something that was severely lacking in the previous model.

  583   Tue May 27 12:52:22 2025 Xuesi MaUpdate  

Using the configuration in section 2.11.1 in the Sorensen installation and operation manual (attached below), I'm able to remote control the Sorensen power supply.

I use DAC VEXC8 as the external voltage source and a breakout board to match the configuration of connector J3.

I have recorded 7 cycles (attached below), and am now working on analyzing the data.

Attachment 1: operating-manual-Sorensen-DCS-programmable-switching-dc-power-supplies-1kw-dcs-e.pdf
operating-manual-Sorensen-DCS-programmable-switching-dc-power-supplies-1kw-dcs-e.pdf
Attachment 2: 20250515_171905.jpg
20250515_171905.jpg
Attachment 3: 20250515_164637.jpg
20250515_164637.jpg
Attachment 4: 20250515_164634.jpg
20250515_164634.jpg
Attachment 5: 20250515_164842.jpg
20250515_164842.jpg
Attachment 6: resistance_vs_time_all_channels_all_time_RV_ladder.pdf
resistance_vs_time_all_channels_all_time_RV_ladder.pdf
  582   Mon May 26 23:24:33 2025 MichaelUpdateInterferometer SimulationsInitial Monte Carlo Simulations for Toroidal Mirrors Project
I've run an initial Monte Carlo simulation for statistical comparison of toroidal mirrors for the dual FROSTI TCS case. Below is the link to the slides.

slideshow

  581   Mon May 26 11:15:28 2025 LukeUpdateScripts/ProgramsUpdate to optimization plots
I have created some new optimization plots. I have also started on a model like the previous Desmos model, but in python.

Slides

  580   Wed May 21 14:40:38 2025 Xuesi MaInfrastructureCleanroomCleanroom Temperature

Date and Time: Around 2:20 PM on May 21, 2025

Location and Temperature:

  • Back of the room, around the working station: 85.5 °F
  • Front of the room, around the doorway: 82.3 °F
Attachment 1: 20250521_142051.jpg
20250521_142051.jpg
Attachment 2: 20250521_142220.jpg
20250521_142220.jpg
  579   Mon May 19 10:59:14 2025 Xuesi MaInfrastructure  

Status Update

Previous Status:

All Sorensen power supplies were turned off. The Cymac system was down (all chassis were offline).

If you need more information or assistance in turning them back on, please contact Xuesi Ma.


Update: The systems are now back online.

Note: The Sorensen power supplies’ voltage can now be controlled via channel VEXC8 of the DAC.

If scripting is required, the ezca Python package is highly recommended for interfacing and control.

  578   Thu May 15 12:03:41 2025 Xuesi MaInfrastructureElectronicsNotice

All Sorensen power supplies are turned off. The Cymac system is down (All Chassis are down)

If you need more information or if you need to turn them back on please contact Xuesi Ma.

  577   Tue May 13 12:41:06 2025 TylerUpdateTCSA# Profiles Update
Slides on the A# ITM FROSTI profile modeling efforts can be found here.
  576   Tue May 13 12:35:01 2025 Xuesi MaUpdate  
Attachment 1: resistance_vs_voltage_all.pdf
resistance_vs_voltage_all.pdf
Attachment 2: resistance_vs_voltage_overlay.pdf
resistance_vs_voltage_overlay.pdf
Attachment 3: resistance_vs_time_all_channels_all_time_RV.pdf
resistance_vs_time_all_channels_all_time_RV.pdf
  575   Sun May 11 19:36:42 2025 Luke UpdateScripts/ProgramsNew optimization plots

Slides

I have re-run the optimization plots with the changes mentioned last week. 

I have added the heat maps of the HOM scattering from HR deformation and the HOM scattering due to the OPD difference as well as the curvature actuation of the surface. 

  574   Fri May 9 20:06:27 2025 Luke SummaryCleanroomCleanroom cleaning

[Luke, Mohak, Luis]

We were also able to remove the residue that has built up on the soft walls by donning a skinny bunny suit and with two wipes rubbing both sides of the soft walls at the same time. The wipes would get gummy very quickly and need to be replaced frequently.

Particle Count Measurements:

  • Pre-cleaning (1:20 pm):
    • Zone 3:
      • 0.3 µm: 3577
      • 0.5 µm: 1369
      • 1.0 µm: 485
    • Zone 4:
      • 0.3 µm: 1062
      • 0.5 µm: 442
      • 1.0 µm: 177
  • Started Cleaning (3:00 pm)
  • Finished Cleaning (4:00 pm)
  • Post-cleaning (4:22 pm):
    • Zone 3:
      • 0.3 µm: 3577
      • 0.5 µm: 618
      • 1.0 µm: 132
    • Zone 4:
      • 0.3 µm: 2031
      • 0.5 µm: 397
      • 1.0 µm: 132


Attachment 1: 20250509_particalcount.png
20250509_particalcount.png
  573   Thu May 8 17:41:56 2025 LuisUpdateVACRGA Scan Post Bake

[Ma, Luis]

After taking the RGA scans of the new system, here are the results of the raw and normalized data.We can see that in the post baked system the He peak is way lower, and the peaks around 20AMU are also significantly lower.

Attachment 1: 2025-4-29_HeaterElement-Bake1_ArO_overlay.png
2025-4-29_HeaterElement-Bake1_ArO_overlay.png
Attachment 2: 2025-4-29_HeaterElement-Bake1_ArO_overlayNormalized.png
2025-4-29_HeaterElement-Bake1_ArO_overlayNormalized.png
  572   Tue May 6 13:19:31 2025 Xuesi MaUpdate  
Attachment 1: resistance_vs_time_RV_rise_time_24.pdf
resistance_vs_time_RV_rise_time_24.pdf
Attachment 2: resistance_vs_time_all_channels_all_time_RV.pdf
resistance_vs_time_all_channels_all_time_RV.pdf
  571   Tue May 6 13:07:34 2025 MichaelUpdateInterferometer SimulationsInitial Convergence Plots for Toroidal Mirrors Project
Attachment 1: Convergence_Plots_5_6_25.pdf
Convergence_Plots_5_6_25.pdf
Attachment 2: Convergence_Plots_5_6_25-1.pdf
Convergence_Plots_5_6_25-1.pdf
Attachment 3: aperture_num_points_convergence.png
aperture_num_points_convergence.png
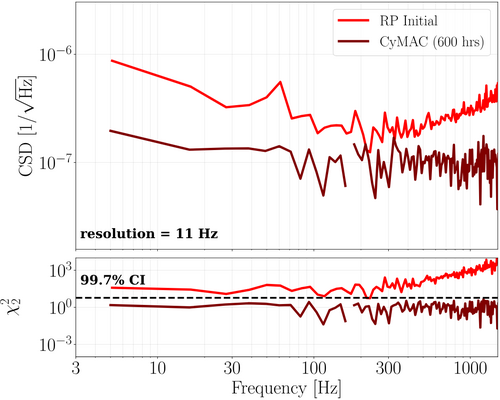
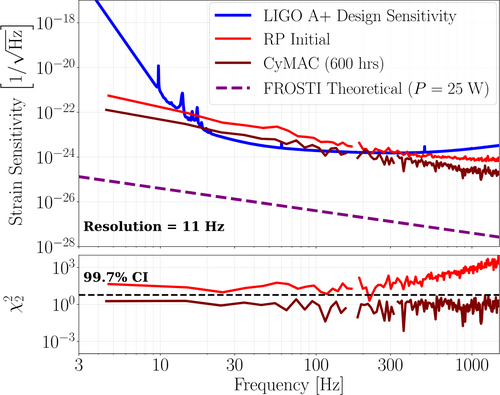
  570   Tue May 6 12:25:03 2025 TylerConfigurationCDSCymac ADC CSD measurement
An initial measurement of the cymbal ADC CSD is attached below. As of now, it seems that the sensitivity limit is roughly the same as that of the Red Pitaya.
Attachment 1: cymac_adc_rin_v1.pdf
cymac_adc_rin_v1.pdf
  569   Sun May 4 18:17:45 2025 Luke UpdateScripts/ProgramsRingheater modeling Update

Slides

I have changed some properties of the thermal model and am re-running the thermal sweeping

I have also been messing around with making a logo

  568   Fri May 2 12:34:02 2025 Xuesi MaUpdateVACStopped bake

The vacuum chamber has stopped baking. 

Current state as of 12:30, 5/2/2025:

The gate valve is open, and the filament of the RGA is on.

The temperatures were steady at:

PID right: barrel upper: 108°C,  RGA volume: 120°C

PID left: barrel lower: 120°C, Lid: 91°C

  567   Wed Apr 30 17:33:14 2025 Xuesi MaUpdateVACStarted bake

[Luke, Ma, Tyler]

The vacuum chamber is currently baking. 

Current state as of 5:00

The gate valve is open, and the filament of the RGA is on. Argon leak is opened

The temperatures are as follows:

PID right barrel upper: 99°C,  RGA volume: 120°C

PID left barrel lower: 123°C, Lid: 92°C

  566   Wed Apr 30 15:43:56 2025 LuisUpdateVACVacuum Update

[Ma, Luke, Luis]

April 29, 2025

3:30 PM
We performed another leak test on the vacuum system, this time focusing on the welds around the main cylinder. The leaks from these junctions were in the mid 10⁻¹¹ range, but we noticed some strange behavior after completing the test. The partial pressure of He kept rising at a slow, constant rate for a while—even after stopping the test for about 15–20 minutes and restarting the measurement. We're not sure what’s causing this and wanted to check in before moving forward with the bake.

4:30 PM
We performed an RGA of the system (see below) and the findings are that there was a higher contraction of He than usual. We have attached another scan from 2/24/25 for reference.

5:00 PM
We turned off the electron multiplier and closed the RGA Program.

Attachment 1: 2025-4-29_HeaterElement-Bake1_ArO.png
2025-4-29_HeaterElement-Bake1_ArO.png
Attachment 2: 2025-2-24_HeaterElement_ArO.png
2025-2-24_HeaterElement_ArO.png
  565   Wed Apr 30 13:42:45 2025 ShaneUpdateCDSUPS comms successful
Update on UPS1 serial interfacing: communication is now successful. On 4/15/25 we connected to UPS1 via ethernet rather than USB, and manually added its static ip address (noted in lab network wiki) to the router. Able to connect and unpack all desired data nicely using telnet server connection via telnetlib. In process of finalizing code and will work next on interfacing UPS2.
  564   Tue Apr 29 10:59:25 2025 LiuUpdateInterferometer SimulationsTest Mass Thermal State Decoder with Updated Comparison Cases
Attachment 1: Update.pdf
Update.pdf
  563   Mon Apr 28 22:08:28 2025 LuisUpdateVACVacuum Leak Test result

[Ma, Luke, Luis]

April 24, 2025

3:00 PM
Ma and Luis attempted to connect to the RGA to initialize the leak test but encountered some difficulties.

3:20 PM
After restarting both the computer and the RGA, we realized that the DB9 cable was not connected to Spica. After connecting it, we had no further issues communicating with the RGA.

3:30 PM
Luke and Luis performed the leak test. There were no significant leaks in the vacuum system. The highest leak rates we found are listed in the table below; the rest of the entries were limited by noise, as we could not detect any change in the program after spraying the ports with He.

Connection Leak rate (torr)
ZLR(2.75"-4.5") - Reducing Cross 6.0e-12
Cross - Turbo Pump (small) 1.4e-11
Port - Pressure Sensor 8.0e-12
  562   Fri Apr 25 19:18:10 2025 Luke UpdateScripts/ProgramsNew optimization plots

I have created two more plots. One on the transmitted power for a specific configuration. This was done by taking the product of the efficiency and the power released by surface area of the source plane for a configuration assuming it is at 300C. The second is a plot of how close the reflector is to the test mass I have included a contour line at 2mm the nominal proximity constraint. Both of these plots are generated for a 2cm wide target plane.

Somethings of note: Because the proximity requires no modeling and can be determined purely mathematically it is easy to re-generate this plot of other target widths. If you increase the target width the proximity contour moves upward and downwards if reduced.

Attachment 1: effective_power.png
effective_power.png
Attachment 2: proximity.png
proximity.png
  561   Fri Apr 25 09:09:03 2025 Luke UpdateScripts/ProgramsUpdate to optimization plots
I have calculated the curvature of the surface plots and created a heat map out of the data. I have also created a contour plot of them together. It is very rough and the artifacts at small w make it hard to read. I am planning on excluding that data and replot them. In the meantime I have created a temporary function that balance the two values. (log_10(curvature/HOMscattering))
Attachment 1: HOM_scattering_100kg_modified.png
HOM_scattering_100kg_modified.png
Attachment 2: curvature_100kg.png
curvature_100kg.png
Attachment 3: initial_contour_plot_with_hom_and_curvature.png
initial_contour_plot_with_hom_and_curvature.png
Attachment 4: temp_quality_(log10_ratio).png
temp_quality_(log10_ratio).png
  560   Tue Apr 22 13:00:04 2025 NathanUpdateVLC UpdatePhotodiode signal check and additional signal check due to 20Mhz signal and amplifier
In general, photodiode was able to achieve signal. Below are the voltage signals and frequency measurements of the photodiode with the dc bias and amplifier connected to the EOM (Vpp = 2mV for first and Vpp= 1 for second). Also I need assistance in using the PZT driver.
Attachment 1: thumbnail_(8)_(1).jpg
thumbnail_(8)_(1).jpg
Attachment 2: vpp.jpg
vpp.jpg
  559   Tue Apr 22 12:08:46 2025 Xuesi MaUpdate  

Test 7: Reconnect ribbon cables

  • Setup: Reconnect all the ribbon cables, and turned on the AI Chassis while isolated rack
  • Observation: No spike observed.

Test 8: Reconnect to rack

  • Setup: Reconnect the AI Chassis to the rack.
  • Observation: No spike observed.

Test 9: Restore to original position.

  • Setup: CLose up the AI Chassis, and put it back to its original location.
  • Observation: No spike observed.
Attachment 1: 20250415_161755.jpg
20250415_161755.jpg
Attachment 2: 20250416_174640.jpg
20250416_174640.jpg
Attachment 3: 20250422_105614.jpg
20250422_105614.jpg
  558   Tue Apr 22 11:04:31 2025 LiuUpdateInterferometer SimulationsTest Mass Thermal State Decoder Update with Interferometer Operation
Attachment 1: Update.pdf
Update.pdf
  557   Tue Apr 22 08:00:39 2025 Luke UpdateScripts/ProgramsThermal optimization modeling 40kg

I have redone the width and location optimization with a 40kg test mass. This was to see where the nominal ring heater would fall in this optimization map see attached.

There are two concerns I have with this modeling:

  1. I am using normalized power only imparting 1W, which may effect the single pass scattering used for optimization.
  2. I am only looking at the surface deformation and I believe that looking at OPD may also be something that is important to consider. 

Note z_RH is measured from the HR surface and w_RH is the half width of the target plane

Attachment 1: 40kg_into_HOM.png
40kg_into_HOM.png
  556   Mon Apr 21 16:56:42 2025 MichaelUpdateInterferometer SimulationsFixed Observed Squeezing Curve for Toroidal Mirror Case
We've resolved the issue with the observed squeezing curve for the toroidal mirror case showing worse performance at lower frequencies and better performance at higher frequencies compared to the nominal case. This issue was caused by the beam parameter at the squeezer being fixed before changing the radii of curvature of the mirrors. This has been changed to be fixed after changing the mirrors, and we see an improvement in the toroidal mirror case.
Attachment 1: updated_observed_squeezing_plot.png
updated_observed_squeezing_plot.png
  555   Thu Apr 17 12:12:29 2025 LiuHowToInterferometer SimulationsPreventing Thread Contention in Multiprocessing with Finesse and Cython

Avoiding Thread Contention When Using Multiprocessing with Finesse and Cython

When running Monte Carlo simulations or other computational workloads, it's common to use Python's ProcessPoolExecutor to parallelize multiple independent tasks. This approach works well—until it interacts with low-level libraries that themselves use multi-threading under the hood.

The Problem: Thread Over-Subscription

In a recent project, I ran into a significant performance issue while executing a large number of Monte Carlo trials using a process pool with 30 worker processes on Megatron (with 48 cores). Each trial ran a function that internally used cython.parallel.prange for fast, element-wise operations, which is what Finesse uses under the hood for many internal numerical calculations. Cython, via OpenMP, was configured to use all available CPU threads per process by default.

This resulted in severe thread over-subscription. With 30 parallel processes and each process attempting to use all 48 threads, the system was launching over 1,400 threads concurrently. The CPU quickly became saturated, and the tasks stalled. In some cases, the system became unresponsive, and the jobs had to be canceled repeatedly.

This happens because when the function calls into these libraries from within a Python multiprocessing context, each subprocess will attempt to use the full number of threads available to the machine.

The Solution: Limit Threads per Process

The solution is simple: explicitly limit the number of threads each subprocess is allowed to use. This can be done by setting the environment variable at the top of your script, before importing any thread-hungry libraries like Finesse.

      
import os
os.environ["OMP_NUM_THREADS"] = "1"


By setting OMP_NUM_THREADS to "1", we ensure that each multiprocessing worker uses only one thread internally, preventing them from overloading the system and allowing the tasks to run more efficiently.

  554   Tue Apr 15 11:37:17 2025 CynthiaUpdateInterferometer SimulationsFinishing up mirror coating map step
Attachment 1: updates_4_15_2025.pdf
updates_4_15_2025.pdf
  553   Tue Apr 15 11:13:43 2025 Xuesi MaUpdate  

Test 4: AI Chassis ground isolation

  • Setup: AI Chassis isolated from the ground with readout directly connected to adapter board
  • Observation: No spike observed.

Test 5: Ribbon cable check

  • Setup: AI Chassis remains isolated from the ground. The signal is measured after the ribbon cable. (Attachment 3)
  • Observation: No spike observed.

Test 6: Single ground connection check

  • Setup: AI chassis powered on but remains isolated from the frame. The signal is measured from the output of the AI Chassis. (Attachment 1 ,2)
  • Observation: No spike observed.
Attachment 1: 20250414_120428.jpg
20250414_120428.jpg
Attachment 2: 20250414_120423.jpg
20250414_120423.jpg
Attachment 3: 20250411_163105.jpg
20250411_163105.jpg
  552   Tue Apr 15 11:09:37 2025 LiuUpdateFLIRTest Mass Thermal State Decoder Update with robustness study
Attachment 1: Update.pdf
Update.pdf
Attachment 2: Update.pdf
Update.pdf
  551   Tue Apr 8 20:04:35 2025 NathanUpdateVLC UpdatePDH Lock Progress
Connected the DC bias and mixer. Need to connect signal generator now to RF Amp and mixer, and also need to connect power supply. After that will see if I can get a detection on the oscilloscope and if so will set up the driver. [Photos attached]
Attachment 1: IMG_5450.jpeg
IMG_5450.jpeg
Attachment 2: IMG_5449.jpeg
IMG_5449.jpeg
  550   Tue Apr 8 12:15:59 2025 Luke UpdateScripts/ProgramsUpdated optimization plot
Attachment 1: HOM_scattering_w__nominal_and_min.png
HOM_scattering_w__nominal_and_min.png
  549   Tue Apr 8 10:47:10 2025 LiuUpdateGeneralTest Mass Thermal State Decoder Update
Attachment 1: Update.pdf
Update.pdf
  548   Tue Apr 8 00:17:01 2025 MichaelUpdateInterferometer SimulationsSqueezing Performance Graphs for Case With and Without Toroidal Mirrors in LIGO
I've created some graphs for the frequency dependent observed squeezing level in LIGO for both the nominal case and the case where we include toroidal mirrors, giving some interesting results. https://docs.google.com/presentation/d/1RBr47hNaxFTdGrwys5ZCUEUOgVOVHmZ2B_5EQwY62IY/edit?usp=sharing
  547   Mon Apr 7 13:28:49 2025 Xuesi MaUpdate  

Test 1: Adapter Board Connected to Filter Board

  • Setup: AI Chassis is powered on. Signal is measured directly from the adapter board. All other ports on the adapter board are connected to the filter board.
  • Observation: Two distinct spikes observed at the beginning of the measurement.

Test 2: Adapter Board Disconnected from Filter Board

  • Setup: AI Chassis remains powered on. Signal is again measured directly from the adapter board. This time, the remaining ports on the adapter board are not connected to the filter board.
  • Observation: Multiple spikes observed, distributed evenly across the entire measurement.

Test 3: Isolation Test with Spare Adapter Board (ongoing)

  • Setup: Suspecting the original adapter board may be faulty, a spare adapter board is used for comparison. Signal is measured directly from this spare board.

Update, 04/08/25, Tue 17:30

Took the old adapter board out of the AI chassis and and used it to connect DAC to AA chassis. If no spikes are seen, it means that the glitches are not originating from this board.

Also checked al the previous spikes using the raw data (65536 Hz sample rate). The duration of the glitches are ~1 second, despite the previous guess that they are happening in the Milli-second scale.

Attachment 1: 20250403_151946.jpg
20250403_151946.jpg
Attachment 2: ELOG_Spike_adapter_filter_on.png
ELOG_Spike_adapter_filter_on.png
Attachment 3: 20250404_143624.jpg
20250404_143624.jpg
Attachment 4: ELOG_Spike_adapter_isolate.png
ELOG_Spike_adapter_isolate.png
Attachment 5: 20250407_105846.jpg
20250407_105846.jpg
  546   Thu Apr 3 13:23:37 2025 shaneUpdateCDSUPS interfacing
Update on UPS serial interfacing: the driver for the UPS webcard has been installed on spica (for UPS1 in room 1119) and logrus (for UPS2 in room 1129). Static IP addresses have been assigned for both and noted on the lab wiki. Neither is yet able to connect, as the initial ip address webpage connection test failed for both. In the process of troubleshooting now.
  545   Tue Apr 1 11:47:08 2025 LiuUpdate  
Attachment 1: Thermal_state_decoder_update.pdf
Thermal_state_decoder_update.pdf
  544   Mon Mar 31 15:41:56 2025 Xuesi MaUpdate  

The result from AI Chassis bypass test showed that the AI Chassis may be the problem. There are no spikes from DAC's direct output.

All chassis except timing chassis are turned off. Power supplies for 24V, 18V, and -18V are turned off

The AI chassis has been taken out of the rack for further inspection

Refer to:

https://dcc.ligo.org/LIGO-E2300117

https://dcc.ligo.org/cgi-bin/private/DocDB/ShowDocument?.submit=Identifier&docid=D2300124&version=

  543   Mon Mar 31 11:26:45 2025 Luke JohnsonUpdateScripts/ProgramsHeatmaps of power delivery performance
These plots show the required temperature to release 100W of power and the efficiency of a particular configuration with half-width w and distance away from the barrel z. I want to add to these heat maps a limit line that has restricts the proximity of the reflectors from the barrel.
Attachment 1: temp_required.png
temp_required.png
Attachment 2: efficiency.png
efficiency.png
  542   Tue Mar 25 12:56:47 2025 TylerUpdateTCSFROSTI Analysis Finalization

Upon final review of the FROSTI analysis included in the (hopefully) soon-to-be submitted instrument paper, I've made some adjustments to the reflectivity analysis that estimates the amount of power delivered to the test mass by the FROSTI. Initially, as detailed in elog 447, the delivered power was approximated to be 12.6 W (later adjusted to 12.9 W), with roughly 18% of this power being reflected by the test mass. After some final adjustments, this value now is closer to 12.0 W, with 10.2 W absorbed (15% power reflection). Below is a table showing the updated values for the FROSTI prototype tests:

Old Value New Value
Delivered Power 12.9 W 12.0 W
Absorbed Power 10.6 W (18% reflectivity) 10.2 W (15% reflectivity)
Measured Peak Temperature Difference 5.39 +/- 0.03 K 5.26 +/- 0.03 K
Model Peak Temperature Difference 5.42 K 5.21 K
Measured Peak OPD 765 +/- 9 nm 771 +/- 7 nm
Model Peak OPD 630 nm 654 nm
Attachment 1: FROSTI_OPD_profile.pdf
FROSTI_OPD_profile.pdf
Attachment 2: FROSTI_temperature_profile.pdf
FROSTI_temperature_profile.pdf
  541   Sun Mar 23 15:39:06 2025 Luke JohnsonUpdateScripts/ProgramsRingheater Location optimization
Attached are some plots that show a new parameter sweep with a finer mesh then before. I have also been able to get a heatmap of power of HOMs in a very simple finesse model.
Attachment 1: _4-4.png
_4-4.png
Attachment 2: _40.png
_40.png
Attachment 3: 02.png
02.png
Attachment 4: HOM_power.svg
HOM_power.svg
  540   Tue Mar 11 11:28:52 2025 CynthiaUpdateInterferometer Simulationsflattening mirror to study power discrepency
Attachment 1: updates_3_11_(1).pdf
updates_3_11_(1).pdf
  539   Tue Mar 11 10:43:57 2025 Xuesi MaUpdate  

Continue investigation in the spikes

Pulsed ADC with a function generator and find no spikes. Rules out ADC for causing the spikes

Loopback test that bypasses the FROSTI Chassis shows spikes (spikes happened on all channels at the same time)

Next step is to bypass the AI Chassis to find the source of the spikes

Attachment 1: 20250310_171936.jpg
20250310_171936.jpg
ELOG V3.1.3-7933898