| ID |
Date |
Author |
Type |
Category |
Subject |
|
356
|
Wed Mar 27 00:03:57 2024 |
Pooyan | Update | Computers | Chimay relocation to Physics 1129 |
[Jon, Pooyan]
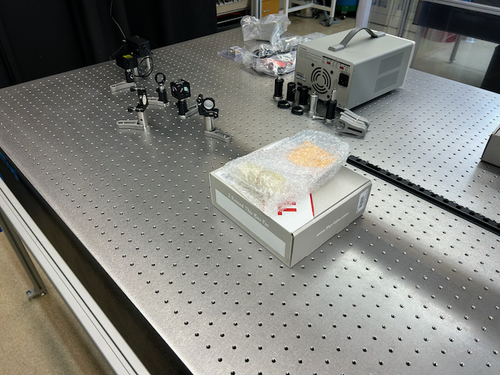
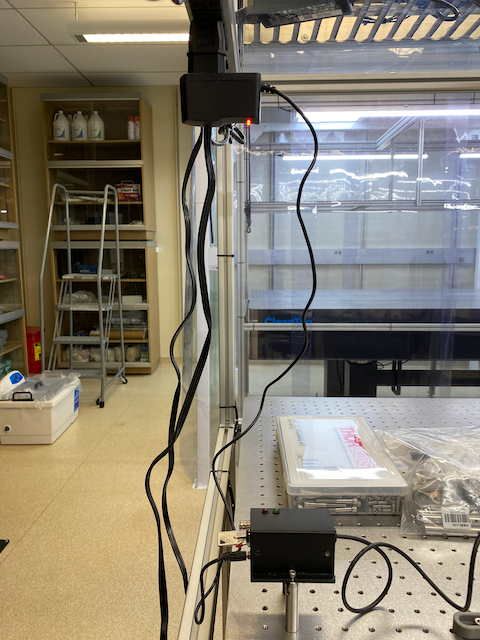
Moved Chimay from the server rack in Physics 1119 to a new rack in Physics 1129. It is connected to the switch in that rack and has the same ip address as before.
All services are up and running.
It appears that JupyterHub creates some processes whenever a user connects to an instance of it, but in some cases does not stop those processes after the user is not using that instance. This results in having lots of running idle processes, each using a small bit of the resources. Those processes are killed now as a result of rebooting. It might be a good idea to manually restart JupyterHub (or the whole machine) every few months to avoid this. |
| Attachment 1: Chima_front.jpg
|
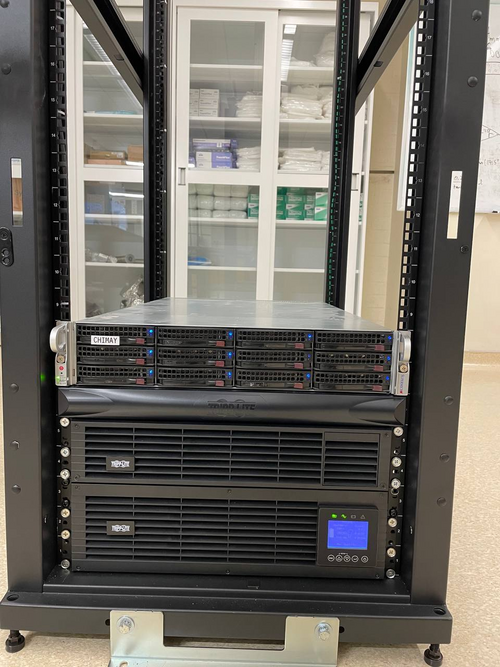
|
| Attachment 2: Chimay_back.jpg
|
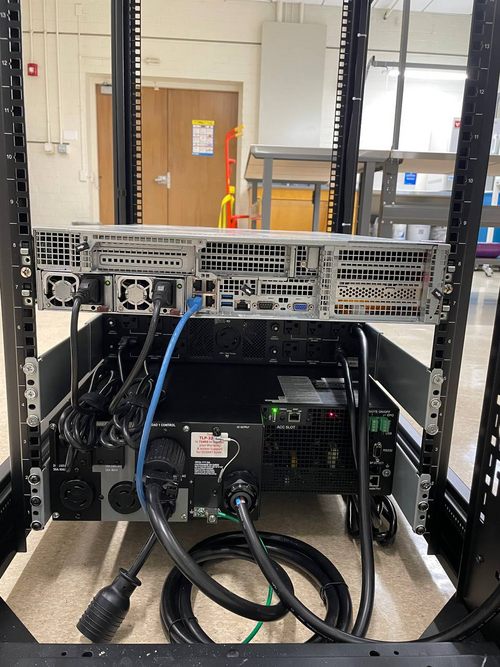
|
|
437
|
Mon Sep 9 14:27:36 2024 |
Pooyan | Infrastructure | Computers | Chimay backup attempt |
One ongoing work is to make all lab machines automatically backed-up on Scribe on a daily basis. The updates should be boatable and stored for some time (potentially a few weeks) on Scribe. Making whole disk images has already been tried for some of the machines with no problems. (e.g., Cymac and WorkStations)
The same thing can not be done with Chimay though, as it currently has one huge RAID-controlled volume that stores all the information (OS, home directories, and NDS-downloaded data). Creating daily full disk images of such a system is not practical.
Here is the plan we came up with to overcome this issue:
- Create one full disk image of Chimay and store it on Scribe (it was already done)
- Move the nds-downloaded raw data temporarily to Scribe and remove it from Chimay
- Make another full disk image of Chimay
- Burn this image to a single disk and boot chimay with it
-
Restore the rest of Chimay disks and move the NDS data back
On the weekend (Sat and Sun 9/7-8) I tried to execute these steps. There wasn't enough free space left on Scribe to move all the NDS data to it, so I stored part of this data temporarily on WS4. Then I also checked storage-consuming directories and, in one case, removed some non-important stored files. As there was no free space left on Scribe to execute step no. 3, I initiated storing the image on WS3. Unfortunately, a couple of different trials of the image-creation process failed as there was not enough free space on WS3 to accommodate Chiamy image as well. I was not able to reduce the image size such that it can be stored on WS3.
These are the options left for us to get this work done.
- Distribute the NDS files between different machines to make enough free space on Scribe for the image and then follow the previous plan
- Shrink the Chimay drive size, create the image and then follow the previous plan
- Temporarily transfer some services to Megatrone (Network gateway, Wiki, elog) and recreate chimay and its services from scratch
|
|
171
|
Mon Jul 24 16:19:29 2023 |
Shane, Jon | Update | Electronics | Chassis semi-assembled and moved |
| Began assembly on AA and AI chassis today, moved them both to top work bench shelf (image attached). They are delicate so please do not disturb them or put anything on top of them. |
| Attachment 1: IMG_8386.pdf
|

|
|
95
|
Tue May 9 20:55:12 2023 |
Jon | Infrastructure | VAC | Calibrated Ar leak rate |
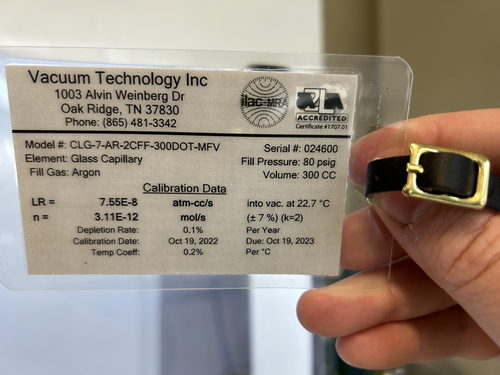
For future reference, the calibrated Argon source has a leak rate of 7.55E-8 atm cc/s, or equivalently 5.74E-8 torr L/s. This can be used to calibrate RGA scans to units of physical leakage (outgassing) rate. |
| Attachment 1: VTI-Calibrated-Ar-Leak.jpeg
|
|
|
353
|
Sun Mar 24 11:50:37 2024 |
Aiden | Update | Clean & Bake | Cal Tech FROSTI Parts |
| Bagged the FROSTI legs and feet after the conclusion of the clean and bake. They are double bagged and sitting in the flow bench. |
|
326
|
Tue Feb 13 13:02:41 2024 |
Pooyan | Update | Interferometer Simulations | Cacity sacn of Fabry-Perot |
| Created a simple model of Fabry-Perot cavity in SIS, and did a cavity scan. Total power in the cavity, 00 mode, and HOMs is measured. |
| Attachment 1: IFOSim_update_2_13_24.pdf
|

|
|
402
|
Thu Jul 11 21:01:37 2024 |
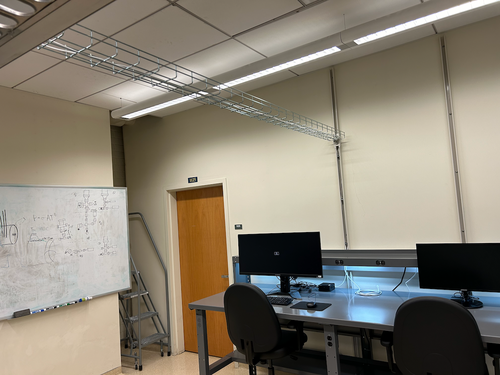
Jon | Infrastructure | General | Cable tray installed in 1129 |
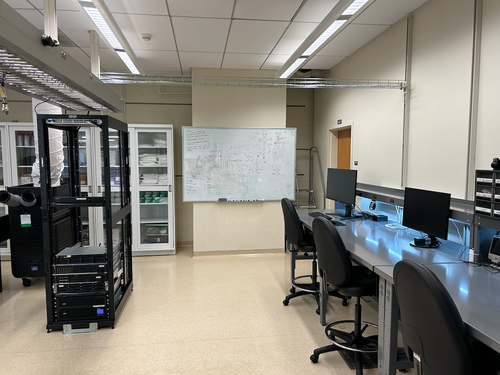
| Today I installed a 10' cable tray in 1129, for permanently routing Ethernet lines to the workstations. It is securely bolted to C-channels in the side wall and in the center cable tray. |
| Attachment 1: IMG_1395.png
|
|
| Attachment 2: IMG_1396.png
|
|
|
418
|
Tue Jul 30 07:42:47 2024 |
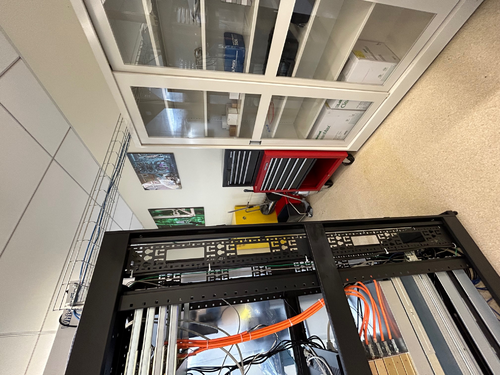
Jon | Infrastructure | General | Cable tray installed in 1119 |
| Yesterday I installed another 5' cable tray in 1119, for permanently routing Ethernet lines to the L-bench. It is securely bolted to the top of the electronics rack, on one end, and to the top of the glass-door storage cabinet, on the other. This eliminates the need for the cable ramp which previously sat behind the rack. |
| Attachment 1: cable_tray_1119.jpg
|
|
|
44
|
Mon Mar 6 15:32:58 2023 |
Jon | Infrastructure | General | Cabinet installation completed |
Jon, Cao, Peter
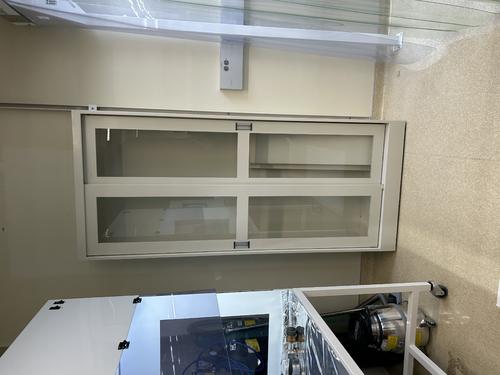
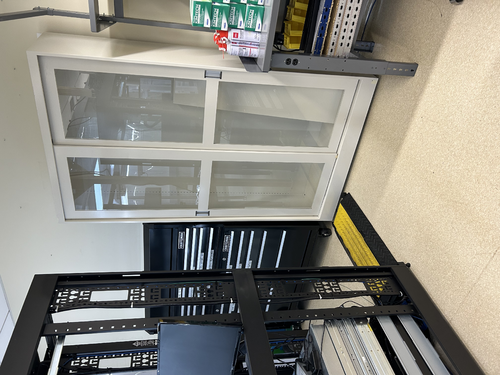
This morning Facilities delivered and installed two new cabinets with sliding glass doors.
The smaller of the two (36" W x 13" D x 84" H) has been installed in the Clean & Bake area adjacent the flow bench. The larger one (48" x 16" D x 84" H) has been installed in the back of the room next to the electronics bench. Both cabinets have been securely anchored to the wall in two places each for earthquake safety.
We also installed the sliding glass doors and leveled them. However, we have not installed any of the shelves yet because the cabinets are quite dirty from the installation. Everything needs to be wiped down with IPA wipes, and it will be easier to do that before the shelves are in place. |
| Attachment 1: IMG_0088.jpg
|
|
| Attachment 2: IMG_0089.jpg
|
|
|
303
|
Mon Jan 15 22:29:34 2024 |
Jon | Infrastructure | General | Cabinet installation & lab clean-up completed |
[Jon, Tyler, Aiden, Shane, Pooyan, Michael, Cynthia, Luke]
On Wednesday, we completed long list of work towards making the new lab (1129) fully operational and enabling the next phase of FROSTI testing.
Cabinet Installation
Three new VWR cabinets with sliding glass doors were installed in 1129. Each unit measures 48" (W) x 22" (D) x 84" (H) and sits along the back wall (see attachment 1). The 350-lb. cabinets were laid in place by Facilities on Monday and permanentized on Wednesday. Work included:
- Earthquake anchoring to the masonry wall
- Sliding glass doors leveled
- Shelving installed
- Wiping down of interior and exterior surfaces with IPA wipes
Server Rack Installation
A new Tripp Lite 42U open-frame rack was laid in place in 1129 and anchored to the floor (see attachment 1). This rack will house all of our general-purpose and simulation computers, which will be relocated from the 1119 rack at a later time.
Lab Clean-Up
Following installation of the new cabinets and rack, we proceeded to organize and clean both labs. Work included:
- Moved parts and equipment into permanent storage in 1129 cabinets
- Wiped down surfaces in 1119 and 1129 with polypropylene IPA wipes
- HEPA-vacuumed floors of 1119 and 1129
- Mopped floor in 1119 with Liquinox solution
- Installed new sticky mats in 1119 and 1129
- Regular cleanroom cleaning and particle counts (see 302)
- Positioned new stainless steel gowning bench outside the cleanroom (see attachment 2)
At this point, the only piece of lab equipment still to be delivered is a HEPA garment cabinet for reusing our (semi-disposable) bunny suits. It is schedule to arrive in mid-February and will sit outside the cleanroom in 1119, in the former location of the HEPA flow bench. |
| Attachment 1: 1129.png
|
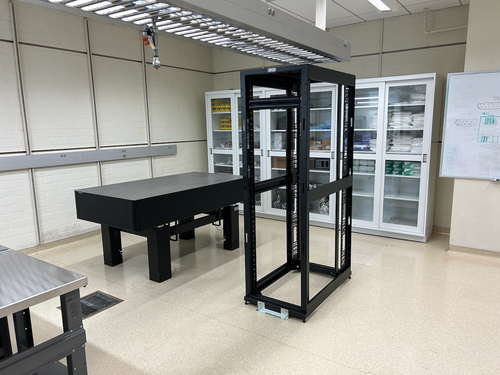
|
| Attachment 2: 1119.png
|
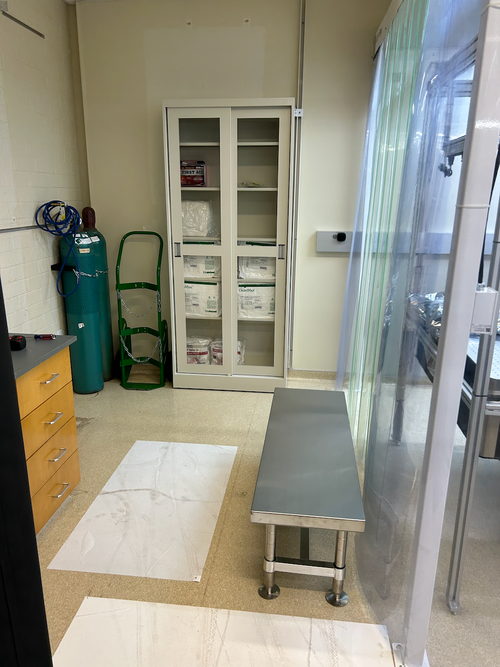
|
|
376
|
Fri Jun 14 13:32:13 2024 |
Liu | Update | Scripts/Programs | COMSOL simulation on rectangular heater elements design |
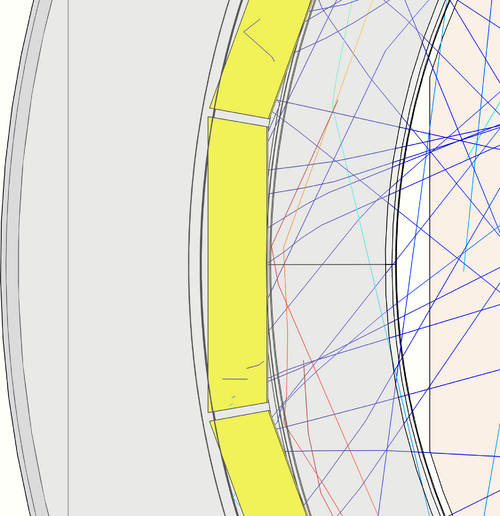
I have been looking at the feasibility of an alternative heater element design for FROSTI that replaces the original ring-like heater elements with n rectangular elements with straight edges. They form an n-sided regular polygon that could well approximate the original annular ring if n is large enough. This eliminates curved surfaces requirement for the heater elements, which was the source of the many month production delay for the prototype parts.
This design was implemented in COMSOL, shown in the attached. From the face on view, each element has a trapezoid shape with straight edges. The edges between neighboring elements are parallel, with a space of 2 mm in between them.
The ray tracing and thermal analysis obtained from COMSOL are shown in the attached pdf.
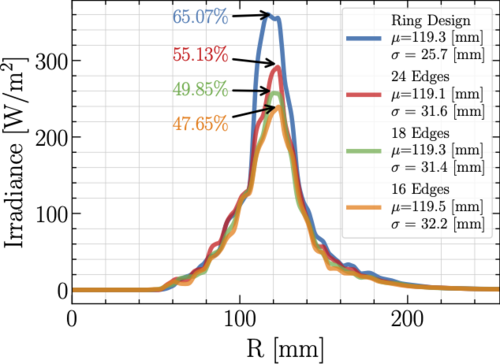
In particular, the 2D irradiance profiles were obtained from the ray tracing (so far from the front heating surfaces only). The 1D radial profiles were integrated and shown in the attached. The power delivery efficiency for the original ring-like heater element design is integrated to be roughly 65%, for comparison. The plot also shows the radial irradiance profiles for three different straight-edge designs, which correspond to 16 edges, 18 edges, and 24 edges. We see that with the straight-edge designs, the irradiance profiles stay in a good Gaussian shape. In addition, with a larger number of edges, the power efficiency increases, but is always less than the case for the optimized ring-like design.
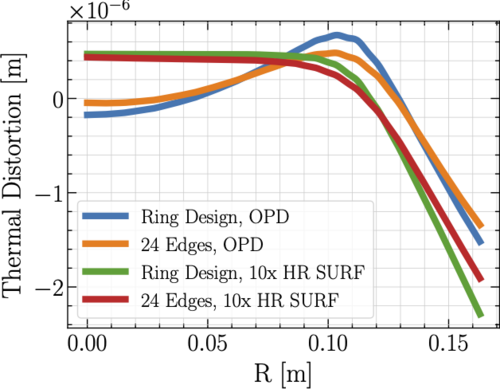
The thermal distortions for the TM were also obtained from COMSOL, using the irradiance profiles at the TM HR. As shown in the attached, with the straight-edge design, the effects on the thermal lens OPD and the HR surface deformation are similar to the ring design, but with less severe edge roll-off for instance. |
| Attachment 1: rayIllu_full.png
|
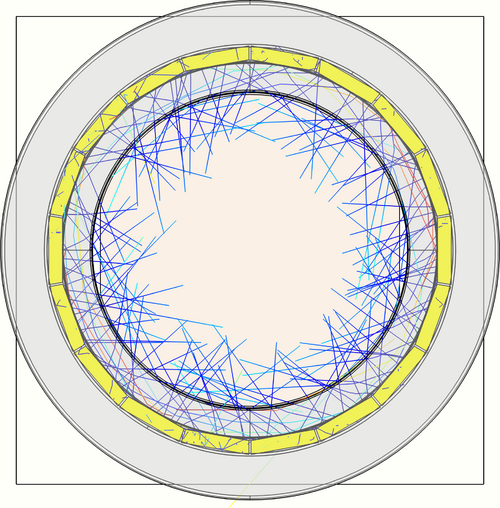
|
| Attachment 2: rayIllu_side.png
|
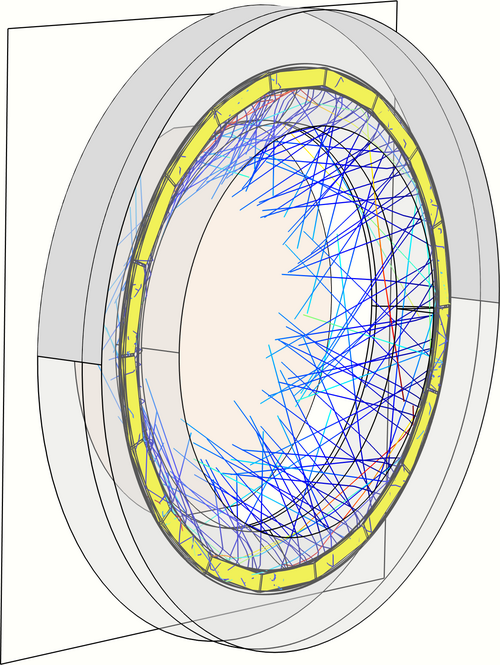
|
| Attachment 3: rayIllu_zoom.png
|
|
| Attachment 4: thermal_distortions.png
|
|
| Attachment 5: results.pdf
|

|
| Attachment 6: Irradiance_profile.png
|
|
|
380
|
Fri Jun 21 11:47:30 2024 |
Liu | Update | Scripts/Programs | COMSOL simulation on alternative straightened heater elements design |
In the previous post, we saw that for the heater element design with straight edges in replacement of the current eight-element ring-like design, it provides the similar Gaussian-like irradiance profiles, but with smaller power delivery efficiencies, as shown in the plot. This turned out to result in similar but less prominent thermal effects.
They only differ from the original baseline design by a source power rescaling, however, as shown in the plot, where we see the power-rescaled irradiance profiles for the straight edge designs are close to that for the ring design. The resulting temperature profiles and thermal distortions are shown in plot and plot. The thermal effects for the 16 straight-edge design with renormalized source power for instance are strikingly similar to that for the original ring design.
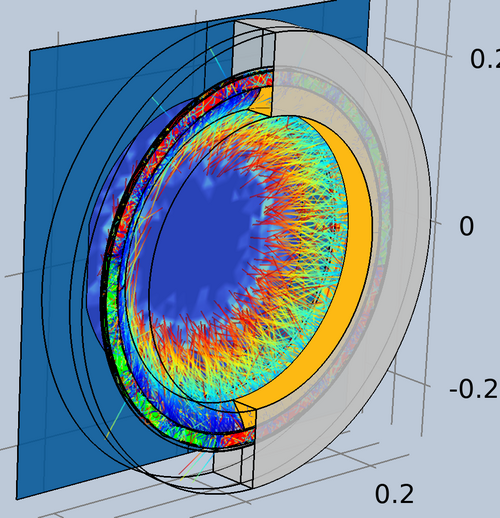
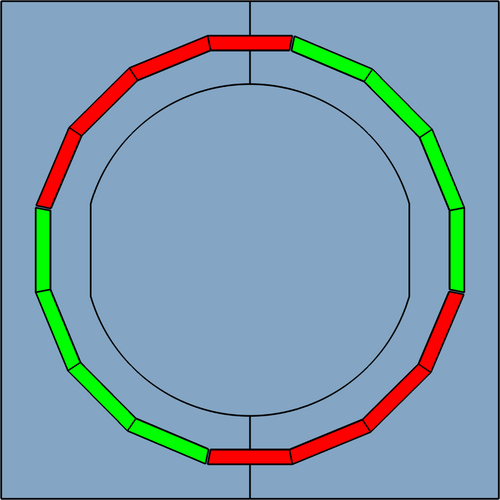
An alternative straightened heater element design has also been investigated with COMSOL FEA simulation. As shown in the attached, in this new design each heater element component is cut with multiple straight edges but remains connected, shown in the same colors (green and red). In the example, four straight edges are cut from each of the four heater components (4x4=16 edges in total). There is no spacing between the neighboring edges from the same element component, but the edges from different components are separated by 2mm, as can be seen in the attached. This new N-in-one straight edge design offers similar irradiance compared to that for the evenly-spaced N-sided regular polygon straight edge design with the same number of edges, as shown in the plot. It however has fewer heater components, four in this case, which makes it easier to implement in assembly and wiring, and less vulnerable to electrical and thermal shorts with their fewer heater element pins. |
| Attachment 1: rayIllu_side_new.png
|
|
| Attachment 2: rayIllu_full_new.png
|
|
| Attachment 3: Irradiance_profile.pdf
|

|
| Attachment 4: Irradiance_profile_norm.pdf
|

|
| Attachment 5: temp_profile.pdf
|

|
| Attachment 6: thermal_distortions.pdf
|

|
|
375
|
Mon Jun 10 14:52:38 2024 |
Tyler | Update | FLIR | CIT FROSTI Analysis Update |
| [Tyler]
Upon further inspection, one adjustment was made to the FROSTI profile analysis: changing the transmission value of the ZnSe viewport. It was initially assumed that the viewport possessed an AR coating, which would bring the transmission into the 90% range. Without the coating, it drops to roughly 70%. Assuming no coating, the estimated delivered power was calculated to be 11.7 W. This is consistent with the estimated power given from the Hartmann sensor analysis, thus it is believed that the viewport indeed had no coating.
| Quote: |
| [Tyler]
Attached below are the initial results of the CIT FROSTI testing analysis.
|
|
| Attachment 1: FROSTI_HR_Temperature_Difference-7.png
|

|
|
586
|
Tue Jun 3 11:54:06 2025 |
Cece Ochoa | Update | | CE Cavity Design Update |
| Update on the design for the CE Cavity Mirrors |
| Attachment 1: CE_Arm_Cavity_.pdf
|

|
|
659
|
Thu Nov 6 12:39:43 2025 |
Cece Ochoa | Update | ELOG | CE Cavity Design Update |
| Updated mode placements and ROC. No thermal effects added yet. |
| Attachment 1: base_0_6_plot.pdf
|

|
| Attachment 2: base_0_7_plot.pdf
|

|
|
663
|
Thu Nov 20 13:03:58 2025 |
Cece Ochoa | Update | ELOG | CE Cavity Design Update |
| Update on grouping 0+8th Order Modes |
| Attachment 1: 11_20_update.pdf
|

|
|
394
|
Fri Jul 5 14:12:32 2024 |
Liu | Update | Interferometer Simulations | CE BS Mechanical Resonances |
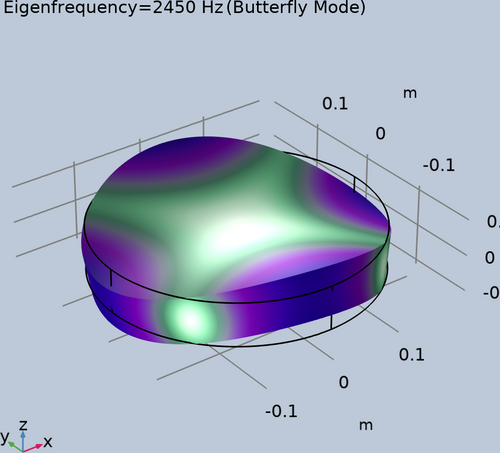
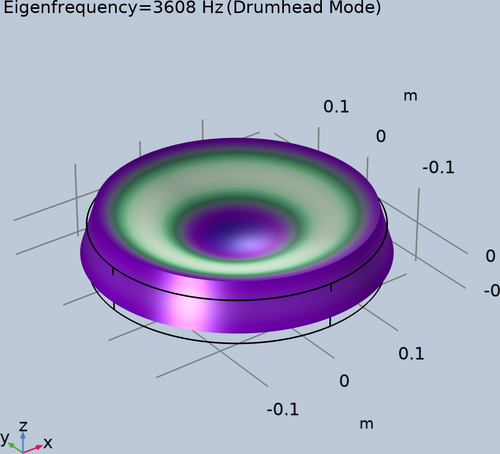
| The butterfly and drumhead mechanical modes for the aLIGO BS were calculated in COMSOL. The resonant frequencies for the two acoustic modes are 2.45 kHz and 3.61 kHz, matching the results in reference for instance.
For a quick projection for the resonant frequencies going from aLIGO to CE, the height and width of the BS are increased assuming the mass is increased from 14 kg to 70 kg, while keeping the aspect ratio fixed. The resonant frequencies for the two mechanical modes as a result becomes smaller, to 1.43 kHz and 2.11 kHz respectively, risking getting in the detection band.
Next step is to implement a mechanical ring with high stiffness outside the BS barrel to combat the decrement of the resonant frequencies of the relevant mechanical modes. |
| Attachment 1: butterfly.png
|
|
| Attachment 2: drumhead.png
|
|
|
585
|
Tue Jun 3 11:50:08 2025 |
Pooyan | Update | CDS | CDS update |
There are three major issues with the lab's CDS system that should be addressed. They are ordered from the highest priority to the lowest.
- CyMAC has stopped serving the fast channels (65k Hz)
The channels are still there, and the data from the slow (16 Hz) channels is served correctly, but the fast data is not served. As a result, diagggui can not retrieve any information at the moment.
Probably the issue is the same as the version conflict between daqd and nds2-server. After installing nds2-server on CyMAC and realizing that the conflict can not be resolved, I reverted the changes so that the CyMAC could be compatible with daqd, but there is a chance that there are still version conflicts that block the fast channels.
I suspect that we have broken the MSC model when adding the new button. This could explain both the fasr-channels fault and the unexpected crashes.
UPDATE 6/5
Fixes this by rebuilding the models.
Note for the future: The c1iop and c1msc models should be rebuilt together, even if no change has been made to c1iop.
- The fast channels were not saved to the frames
Reviewing the frame files showed that the daqd was only saving the 16 Hz data in the .gwf frame files. I had missed this because I only checked the existence and the integrity of the raw frame files, but never retrieved the high-frequency data itself to check it.
- NDS2-server is installed, but does not distribute the data
I managed to install the nds2-server and its satellite programs on the Chimay, and NFS mount the frame files on it. The server successfully chaches the channel names, frame files, and the data, but fails to list the channels for distribution.
Note: CyMAC machine was strangely disconnected from the network, and required manual reboot. I couldn't find any abnormal logs that could explain what happened. |
|
590
|
Tue Jun 10 12:11:14 2025 |
Pooyan | Update | CDS | CDS update |
- The MEDM models issue was fixed. The issue was that building the c1msc model alone was not enough and we had to re-build the c1iop as well, although no changes has been made to the c1iop. Added a note in the wiki on this for future reference.
- For writing the fast channels to the frame files, our CDS system should have a GDS broadcaster. I followed this wiki page to set one, but it breaks the current daqd system. Asked about it earlier today on the CDS Mattermost channel and waiting for a response.
- Maybe I should continue the distributed scheme we have been trying for the nds2-server and let another machine on the network do this.
- Question: daqd has a feature to zero-out the bad data (NaNs), and it is currently on for our system. I don't think that it's a good idea to have this. Should I turn it off?
|
|
592
|
Wed Jun 11 16:19:37 2025 |
Pooyan | Update | CDS | CDS update |
- Fast channels recorded to .gwf frame files
- The fast channels are recorded with an extra _DQ in their names. So, in ndscope and diaggui these two channels should be addressed as
- C1:MSC-V0_OUT_DQ
- C1:MSC-V1_OUT_DQ
-
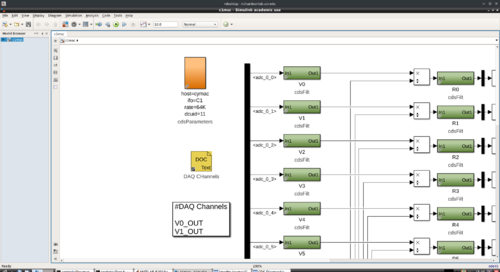
Update 6/13: enabled recording of all the ADC voltage channels so that Tyler can use all the data for the noise floor calculation. attached is an example of diagggui with almost 30 hrs of data.
|
| Attachment 1: Screenshot_20250611_154834.png
|
|
| Attachment 2: f3k.pdf
|

|
|
321
|
Tue Feb 13 01:26:30 2024 |
Peter | Update | Interferometer Simulations | CARM Power Simulations |
| Cao's simulations of the circulating power and gouy phase through a single arm cavity of the interferometer have been reproduced. Images of the plots can be shown in the pdfs attached. There are approx. 400 lines in this code (scenario_3_carm) that produces these plots. This code also calls on a separate code source file (thermal_models) that defines many of the functions used in this main simulation. The thermal_models file consists of over 1000 lines. More work needs to be done to fully understand and document the scripts. |
| Attachment 1: Scenario_3_CARM.pdf
|

|
| Attachment 2: Scenario_3_CARM_Gouy.pdf
|

|
|
199
|
Wed Aug 9 17:35:26 2023 |
Shane | Update | CDS | Binary output chassis finished |
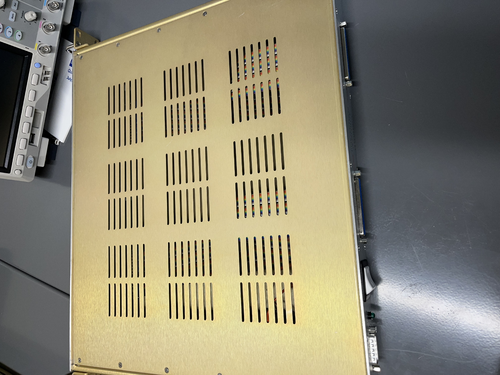
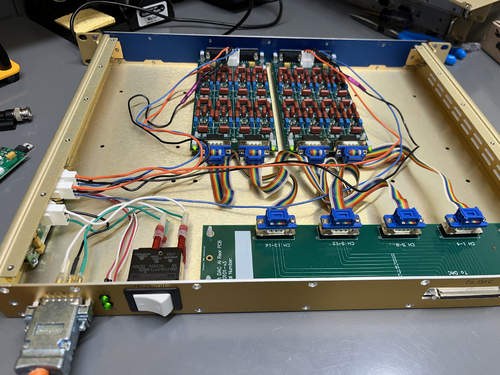
| Finished the internal wiring for the binary output chassis today, which completes its assembly. Also secured ribbon cables and chassis lid with their respective screws. Note: one of the spade lugs' internal metal piece is a little loose and had to be reinserted after falling out once. Seemed secure after this, and I checked continuity on everything and it was all good. |
| Attachment 1: IMG_8685.jpeg
|
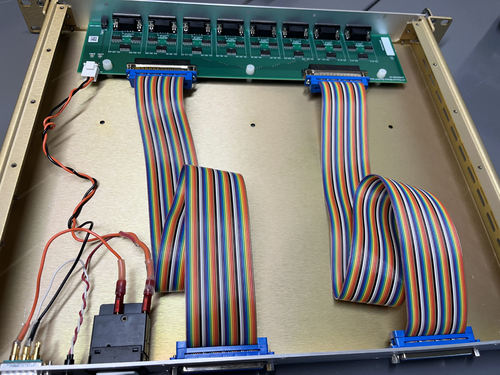
|
| Attachment 2: IMG_8686.jpeg
|
|
|
211
|
Wed Aug 16 17:17:02 2023 |
Shane, Jon | Update | CDS | Binary input chassis powering correctly |
| Binary input chassis passed power-on test, and is lighting up as expected. Binary output chassis also successfully powered on. AA and AI chassis not powering on correctly, need to do some debugging to find the problem. |
| Attachment 1: IMG_9253.jpeg
|
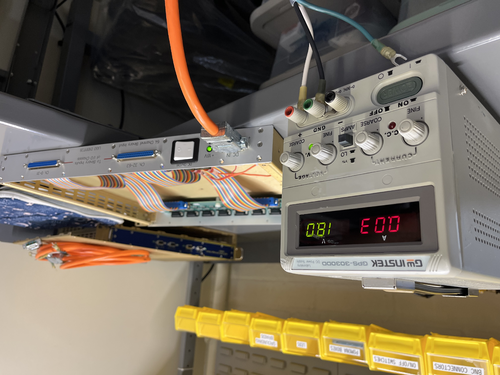
|
|
197
|
Tue Aug 8 17:03:22 2023 |
Shane, Jon | Update | CDS | Binary input chassis finished |
| Finished assembly of the binary input chassis today, including DC on/off switch and LED installation. external cable assemblies still needed, but internal work done. |
| Attachment 1: IMG_8681.jpeg
|
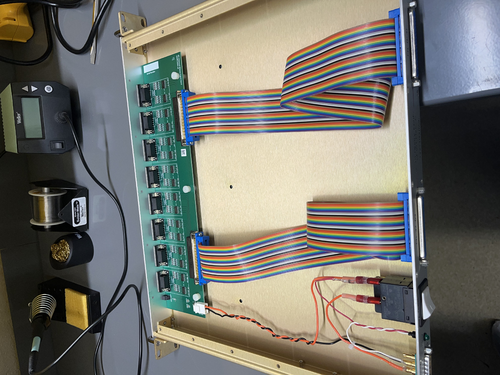
|
|
537
|
Mon Mar 10 21:32:29 2025 |
Nathan | Physics | Electronics | Beam Profiling and PBS Measurements |
| Beam wasn't diverging, however maybe was about to diverge when measurements stopped? Will discuss the PBS measurements and how the voltage changed due to the wave plate. |
| Attachment 1: Beam_Profiling_2_20_(2).pdf
|
.png)
|
| Attachment 2: beamprfl.png
|
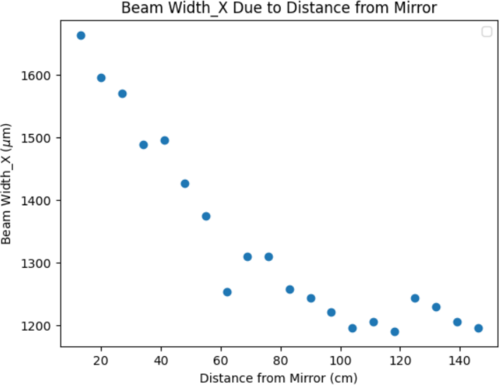
|
| Attachment 3: thumbnail_(6).jfif
|
|
80
|
Thu Apr 27 09:48:34 2023 |
Aiden | Summary | General | Batch 12 Bagging |
| I took batch 12 out of the oven and put them in a bag and placed the bag inside the clean room in the first large stainless steel container.
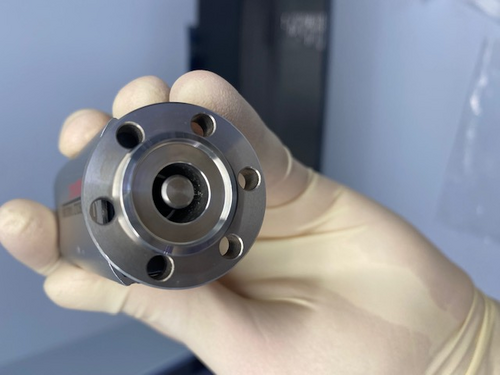
I also looked at the small gauge that we felt like needed to be baked and I can confirm that without further cleaning around the inside of the gauge it should not be connected to the main vacuum. I have attached a photo of the inside of the gauge. |
| Attachment 1: IMG_4279.jpg
|
|
| Attachment 2: IMG_4278.jpg
|
|
|
510
|
Tue Feb 11 08:07:02 2025 |
Luis | Update | VAC | Bake stopped |
[Luis, Ma]
Feb/10/25 4:00pm
Bake was stopped.
|
|
327
|
Fri Feb 16 18:37:28 2024 |
Jon | Update | VAC | Bake ended 6:23 pm |
I ended the bake of the UHV system (that began on Monday) at 6:23 pm today by switching OFF both PID controllers. The heaters elements were run at max power (24 V DC / 200 mA per element) during this bake, and I left them powered at the same level.
At the time, the instrument readings were as follows:
- Left high-limit controller: 138 C
- Right high-limit controller: 128 C
- Left PID controller: 100 C
- Right PID controller: 100 C
- Main volume pressure: 8.17e-7 Torr
- RGA volume pressure: 4.63e-7 Torr
|
|
25
|
Fri Feb 10 15:15:30 2023 |
Aiden | Update | General | Bagging First Batch |
| Aiden Bagged and Tagged the first batch of stainless steel parts shown on the google spread sheet.
1. Removed two parts from the oven.
2. Place them in the ESD bag.
3. Seal bag with Kapton Tape.
4. Create label including part name and number underneath it.
5. Put label onto the side of the bag where it is not sealed with tape.
6. Placed bagged items into clean room on work table.
ps. total bags in first batch = 4 |
|
324
|
Tue Feb 13 12:26:23 2024 |
Tyler | Update | Interferometer Simulations | BS Code Update |
I reproduced Cao's CE beamsplitter code (see below for example plots). I received the current info on the beamsplitter parameters for A+ and A# from GariLynn also. The next steps are to perform a similar power loss analysis on the anticipated A# beamsplitter. |
| Attachment 1: thickness1.pdf
|

|
| Attachment 2: bs_opd_homloss_h6cm_w2cm.pdf
|

|
|
396
|
Mon Jul 8 10:39:14 2024 |
Xuejun | Update | FLIR | Average Temperature Profile |
After taking data for each of the individual heater elements, I imported them into python and overlayed them to produce an average temperature profile. I rotated the 7 of the elements to align with element 1's profile and averaged them out. By setting the range to 28C - 33C (this gave the best visibility of the heating pattern) it gave the profile attached. |
| Attachment 1: Average-Temperature-Profile.pdf
|

|
|
191
|
Thu Aug 3 18:03:42 2023 |
Shane, Jon | Update | CDS | Anti-Aliasing chassis complete |
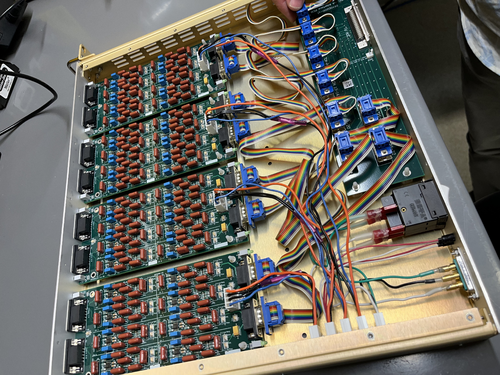
| We finished installing the internal power supply cables in the anti-aliasing chassis today, which concludes its assembly. Work on AI, BI, BO chassis still underway. |
| Attachment 1: IMG_8544.jpeg
|
|
|
154
|
Thu Jul 13 15:31:21 2023 |
Jon | Update | General | Ant traps placed around lab |
In response to reports that ants have been observed in the lab, I placed five ant bait traps around the room today. Each is sitting on the floor on top of a piece of aluminum foil, in areas unlikely to be inadvertently stepped on. They contain liquid which will spill out if picked up, so please take care not to disturb them. |
|
155
|
Thu Jul 13 16:59:03 2023 |
Jon | Update | General | Ant traps placed around lab |
Update: After seeing the strong response to the first set, I redistributed them to the hottest spots and added one more trap.
| Quote: |
|
In response to reports that ants have been observed in the lab, I placed five ant bait traps around the room today. Each is sitting on the floor on top of a piece of aluminum foil, in areas unlikely to be inadvertently stepped on. They contain liquid which will spill out if picked up, so please take care not to disturb them.
|
|
|
598
|
Tue Jun 24 13:47:58 2025 |
Liu | Update | Interferometer Simulations | Alternative FROSTI A# optimization approach |
| Alternative FROSTI A# optimization approach |
| Attachment 1: Update.pdf
|

|
|
63
|
Tue Apr 4 16:43:53 2023 |
Jon | Update | VLC Electronics | Additional Thorlabs PDA10A2 |
| I ordered a second PDA10A2 and mounting post + spacer (which puts the aperture at the VLC's standard 3" beam height). These arrived today and I delivered them to the lab. They are sitting on the VLC table near the laser. |
| Attachment 1: PDA10A2.png
|
|
|
14
|
Wed Dec 14 18:34:33 2022 |
Jon | Configuration | Electronics | Adapter for 532 nm laser power supply |
| I installed an EU-to-US plug adapter for the 532nm laser's 9V power supply. I then re-measured the laser's power with the correct supply voltage (previously we had been using a 6V supply). At 9V, the max power is 0.83 W, so the laser is confirmed to be Class 2 as labeled. |
| Attachment 1: laser_power.png
|
|
|
142
|
Mon Jul 3 16:26:21 2023 |
Cao | Infrastructure | DAQ | Access and control Red Pitaya remotely and run it on local machine |
| [Cao]
To access and control the Red Pitaya using Python locally on a machine within the local network, one should follow these steps:
-
Start the SCPI server. This is achieved by first log onto the Red Piatay page
rp-xxxxxx.local/
- Go to Development >> SCPI server and turn the server on. (Note : The server is currently running)
- Communication with Red Piataya is done through PyVista, install PyVista with:
sudo pip3 install pyvisa pyvisa-py
This has been installed on Chimay. Ensure that you have pip3 install, if not, you can install it using:
sudo apt-install python3 pip
- To start talking to the RedPitaya, ensure you have the scipt
redpitaya_scpi.py in your local folder. This is the standard class that you will import to your code to establish connection with the Red Pitaya. This code can be found in directory ~/RedPiatya or this link
|
|
399
|
Tue Jul 9 18:19:50 2024 |
Shane | Update | CDS | ADC-DAC loopback testing and IOLAN installation |
| [Shane, Jon]
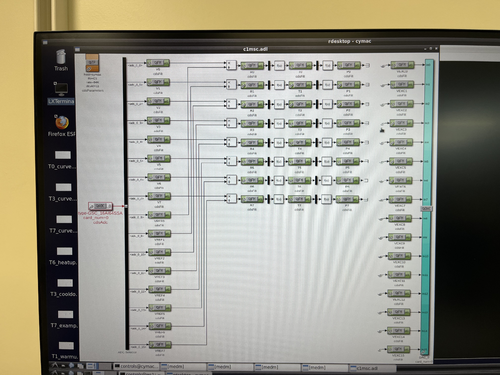
Finished ADC-DAC loopback testing today (see attached xlsx file or access directly here). All looks well with the first 8 channels, with the gain hovering just under 2. Also edited c1msc model in simulink to add channels 7-15 (the last 8 channels), and changed the rate back to 64K. See image 1 for the updated c1msc model. The last 8 channels are also looking good and show no problems, with slightly more scattering for the gain, but all values very close to 2.
We also installed the new eight-channel Perle IOLAN SDS8 terminal server today. Image attached.
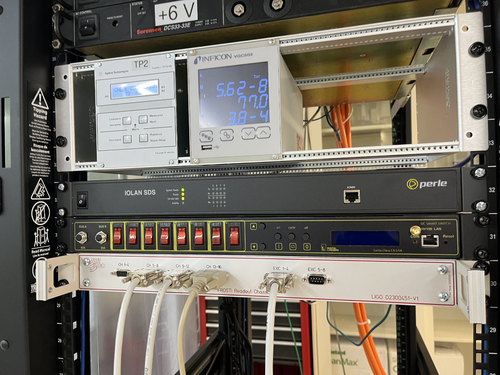
NOTE: When we were installing it, we noticed an energized wire dangling from the 24V power supply. Has since been fixed and put back into place. |
| Attachment 1: iolanServerTerminal.jpeg
|
|
| Attachment 2: ADC-DAC_Loopback_Testing.xlsx
|
| Attachment 3: updatedc1msc.jpeg
|
|
|
410
|
Tue Jul 16 18:43:07 2024 |
Shane | Update | CDS | ADC-DAC loopback testing and IOLAN installation |
|
UPDATE:
Follow up ADC-DAC loopback testing now complete, matching all the ADC channels to a single DAC channel, and then matching all the DAC channels to a single ADC channel (see attached xlsx file or access directly here). Also note c1msc model file has been updated to include the second set of 16 ADC channels. The newly added channels also have their own filter modules, but those are not needed for anything other than the loop-back testing and can now be deleted if we don't want to keep them.
| Quote: |
| [Shane, Jon]
Finished ADC-DAC loopback testing today (see attached xlsx file or access directly here). All looks well with the first 8 channels, with the gain hovering just under 2. Also edited c1msc model in simulink to add channels 7-15 (the last 8 channels), and changed the rate back to 64K. See image 1 for the updated c1msc model. The last 8 channels are also looking good and show no problems, with slightly more scattering for the gain, but all values very close to 2.
We also installed the new eight-channel Perle IOLAN SDS8 terminal server today. Image attached.
NOTE: When we were installing it, we noticed an energized wire dangling from the 24V power supply. Has since been fixed and put back into place. |
|
| Attachment 1: Follow-up_ADC-DAC_Loopback_Testing.xlsx
|
|
285
|
Mon Dec 4 21:27:53 2023 |
Shane | Update | CDS | ADC-DAC loopback test results |
| Here are the test results from today's ADC-DAC loopback tests. Channels 14 and 15 were the only ones behaving abnormally. Not sure what the issue is, but needs further debugging. The DAC output was as expected for both of them, but the corresponding ADC inputs were the same regardless of what offset was used (hovering around values of -4 and -5). NOTE: all measurements listed in the attached table are 'averages' in the sense that the ADC inputs and DAC outputs hovered around the listed values, changing by +1 or -1. |
| Attachment 1: adc-dac_loopback_testing_results.pdf
|

|
|
176
|
Thu Jul 27 14:46:55 2023 |
Shane, Jon | Update | Electronics | AA chassis DC on/off switch assembled |
| Made the first DC on/off switch assembly today and installed in anti-aliasing chassis. Second switch assembly to be completed later. |
|
247
|
Fri Oct 27 15:28:30 2023 |
Shane | Update | CDS | AA and AI chassis for CyMAC powered on and functional |
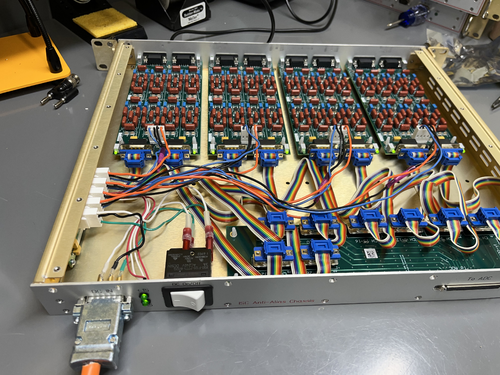
| CyMAC updates: Switched out the faulty power regulator boards in the Anti-Aliasing and Anti-Imaging chassis. Both chassis are now powering up correctly with lights on and the correct voltages in/out of the power regulator board. Images attached. All chassis for the CyMAC now functional, so next step is mounting everything in the rack. |
| Attachment 1: AI_chassis_lights_on.jpeg
|
|
| Attachment 2: AA_chassis_lights_on.jpeg
|
|
|
577
|
Tue May 13 12:41:06 2025 |
Tyler | Update | TCS | A# Profiles Update |
| Slides on the A# ITM FROSTI profile modeling efforts can be found here. |
|
668
|
Thu Jan 15 12:52:58 2026 |
Tyler | Update | TCS | A# FROSTI Profiles 01/15/26 |
| Slides |
|
602
|
Tue Jul 1 12:39:42 2025 |
Tyler | Update | TCS | A# FROSTI Profile Optimization Update |
| [Tyler, Liu]
Slides |
|
632
|
Tue Aug 19 12:33:59 2025 |
Pooyan | Update | TCS | A# BS Update |
|
| Attachment 1: A#_beamsplitter_thermal_lensing.pdf
|

|
|
209
|
Tue Aug 15 16:10:06 2023 |
Celeste | Update | TCS | 8/15/2023 Simulation Progress |
|
| Attachment 1: Simulation_Progress__1_32nd_Model_(2).pdf
|
.png)
|
|
204
|
Fri Aug 11 10:57:20 2023 |
Celeste | Update | TCS | 8/11/23 Simulation Progress |
|
| Attachment 1: Simulation_Progress__1_32nd_Model_(1).pdf
|
.png)
|
|
200
|
Thu Aug 10 14:13:38 2023 |
Celeste | Update | TCS | 8/10/23, Simulation Graphical Progress |
|
| Attachment 1: Simulation_Progress__8_10_23.pdf
|

|