| ID |
Date |
Author |
Type |
Category |
Subject |
|
611
|
Tue Jul 15 10:40:23 2025 |
Christina | Update | TCS | |
[Christina, Ma, Tyler]
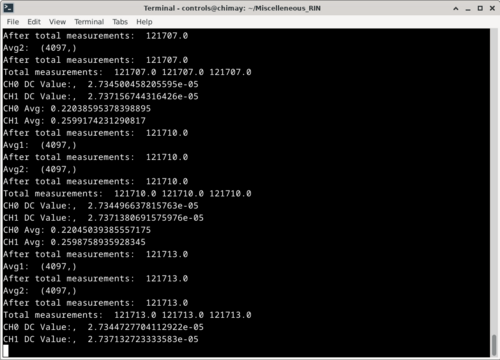
Yesterday, Ma and I started taking data for the PSD/CSD measurements while the photodetectors and one of the heater elements are on (8) and are using the Red Pitaya to compare it to the data we took for the same measurements on the CyMAC. It will be finished Wednesday morning, and then we plan on starting to take additional recordings in order to conduct the same type of comparison for the dark noise measurements. |
| Attachment 1: rpon.png
|
|
|
614
|
Tue Jul 15 13:13:48 2025 |
Christina | Update | TCS | Photodetector optical post assembly |
|
| Attachment 1: pdreassembly.png
|
|
|
615
|
Tue Jul 22 12:20:29 2025 |
Christina | Update | TCS | |
[Ma, Christina, Tyler]
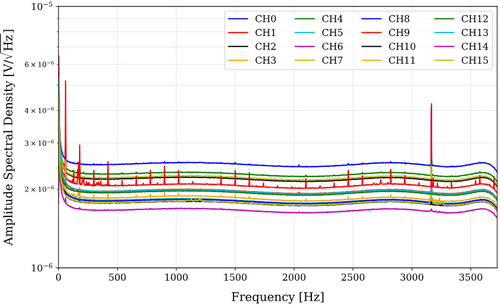
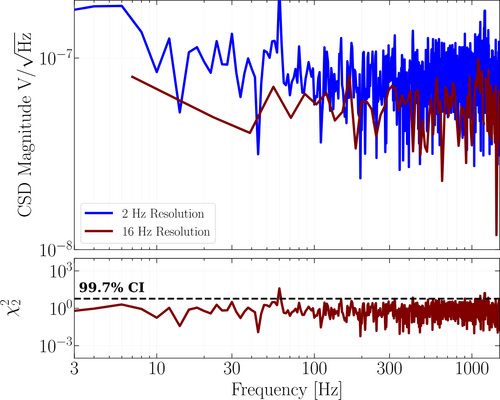
Figure 1 shows the following PSDs for channels 0-15 from the 14 hour test. Figure 2 shows the reduced chi squared and CSD plots for both the 2 Hz and 16 Hz resolutions.
|
| Attachment 1: PSDch0-15.png
|
|
| Attachment 2: CSD2hz_16hz.png
|
|
|
617
|
Tue Jul 29 11:45:19 2025 |
Maple | Update | TCS | Meeting update |
|
| Attachment 1: Maple_TCS_update_jul_29.pdf
|

|
|
619
|
Tue Jul 29 12:30:00 2025 |
Christina | Update | TCS | 260 hour ADC update |
[Ma, Christina, Tyler]
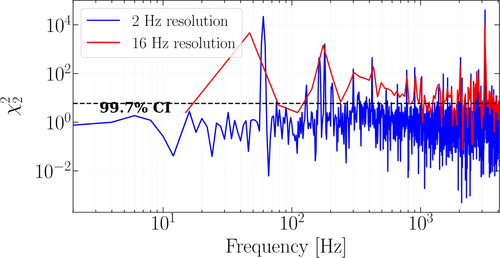
ADC CyMAC 260 hr, 8192Hz sampling rate channels V3 and Vref6 |
| Attachment 1: CSD_06_28_25_270hr.png
|
|
|
624
|
Mon Aug 11 22:19:50 2025 |
Christina | Update | TCS | Red Pitaya Data Streaming |
[Ma, Tyler, Christina]
This past week, we were able to set up the data streaming for continuous acquisition to the PCs, and can conduct the initial tests now. We were able to do this by:
- Installing the correct OS ecosystems to each Red Pitaya
- Installing the terminal streaming client
- Debugging formatting and file saving issues by saving the data in a TDMS file on the host PC.
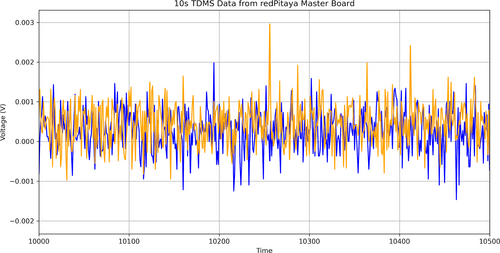
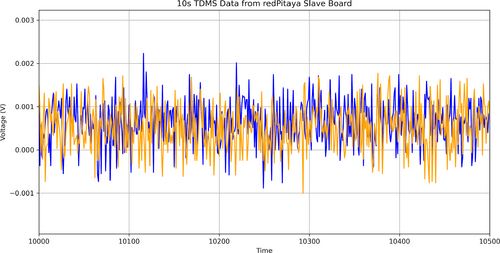
We have started streaming the ADC data on Monday from both boards for 2 days, which are currently in the clean room. Below are the ADC tests we performed before starting the 2-day run. (Time in ms) |
| Attachment 1: 3.png
|
|
| Attachment 2: 3-1.png
|
|
|
627
|
Tue Aug 12 13:28:00 2025 |
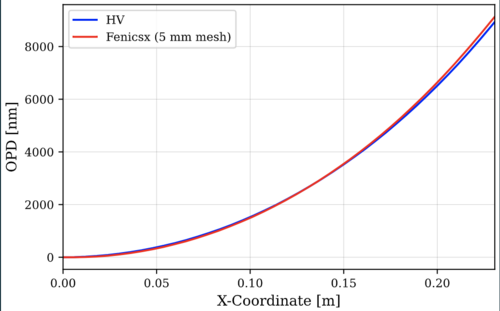
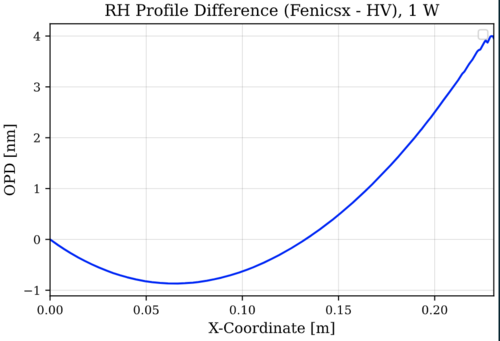
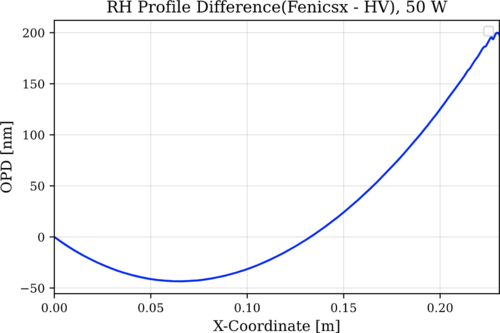
Tyler | Update | TCS | RH Fenicsx v. HV |
|
| Attachment 1: Profile_comparison.png
|
|
| Attachment 2: 1W_diff.png
|
|
| Attachment 3: 50W_diff.png
|
|
|
631
|
Tue Aug 19 12:08:40 2025 |
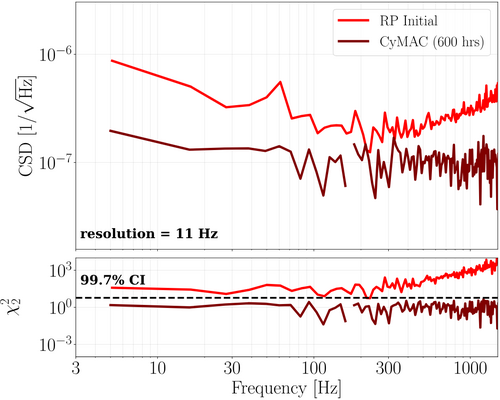
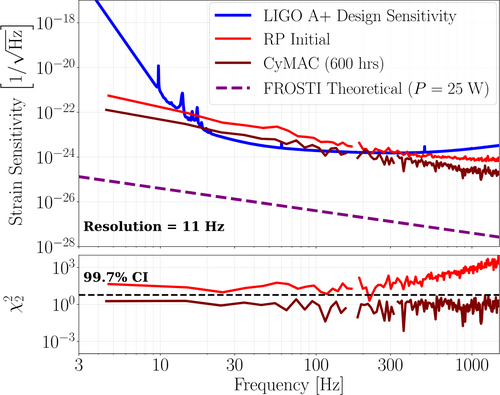
Christina | Update | TCS | RP Initial vs CyMAC Plot Comparisons |
| [Tyler, Ma, Christina]
These are the frequency averaged and veto binned plots for the initial Red Pitaya and CyMAC systems. |
| Attachment 1: 11hzCSD.png
|
|
| Attachment 2: 11hzstrain.png
|
|
|
632
|
Tue Aug 19 12:33:59 2025 |
Pooyan | Update | TCS | A# BS Update |
|
| Attachment 1: A#_beamsplitter_thermal_lensing.pdf
|

|
|
636
|
Tue Aug 26 13:09:03 2025 |
Tyler | Update | TCS | O6 RH Update |
| [Tyler]
Below are slides giving an update on RH O6 design progress.
Slides |
|
637
|
Tue Sep 2 11:53:34 2025 |
Tyler | Update | TCS | RIN Infrastructure Update (09/02/2025) |
| [Ma, Tyler]
Below are slides discussing RIN infrastructural updates related to the CyMAC.
Slides
|
|
642
|
Tue Sep 9 12:06:38 2025 |
Tyler | Update | TCS | RH O6 Update |
| Slides |
|
648
|
Tue Sep 23 13:10:07 2025 |
Tyler | Update | TCS | RH O6 Update 09/23/25 |
| Slides |
|
650
|
Tue Sep 30 12:51:23 2025 |
Tyler | Update | TCS | O6 RH Update 09/30/2025 |
| Slides |
|
664
|
Thu Nov 20 13:54:34 2025 |
Tyler | Update | TCS | FROSTI A# Optimization and Mesh Convergence Analysis |
| Attached below are slides discussing FROSTI A# Irradiance optimization and mesh convergence analysis for penetration depth. |
| Attachment 1: Updates_11_19_2025-3.pdf
|

|
|
665
|
Thu Dec 4 12:10:19 2025 |
Tyler | Update | TCS | FROSTI A# Profiles and Element Width Optimization |
| Slides |
|
666
|
Thu Dec 18 12:51:13 2025 |
Tyler | Update | TCS | FROSTI A# Profiles Update |
| Slides |
|
667
|
Thu Jan 8 12:51:03 2026 |
Tyler | Update | TCS | FROSTI A# Update 01/08/2026 |
| Slides |
|
668
|
Thu Jan 15 12:52:58 2026 |
Tyler | Update | TCS | A# FROSTI Profiles 01/15/26 |
| Slides |
|
669
|
Thu Jan 15 13:52:55 2026 |
Xuesi Ma | Update | TCS | FROSTI A# Reflector Update |
| Slides |
|
162
|
Tue Jul 18 14:13:46 2023 |
Sophia | Update | Scripts/Programs | Update on Laser Noise Data Collection and Analysis |
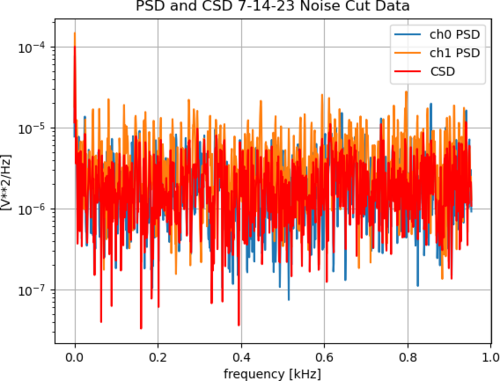
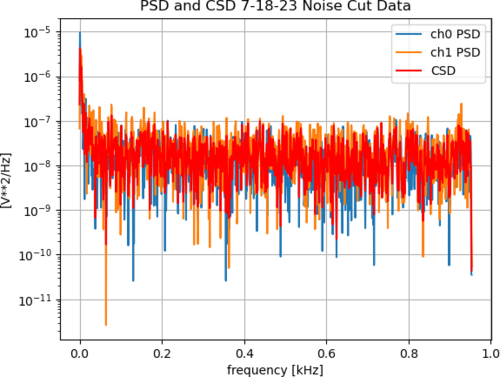
| We [Sophia and Tyler] have found a code which will partition our data and generate PSD's and CSD's automatically. We are now in the stage of writing this into a dynamic code, which so far has been fast-paced because of the framework we have built for it over the past few weeks.
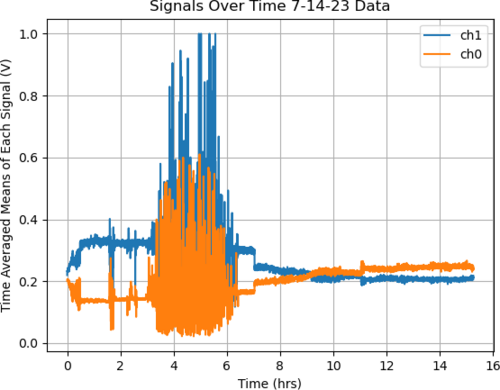
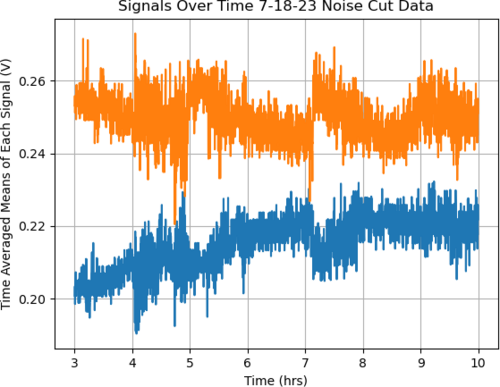
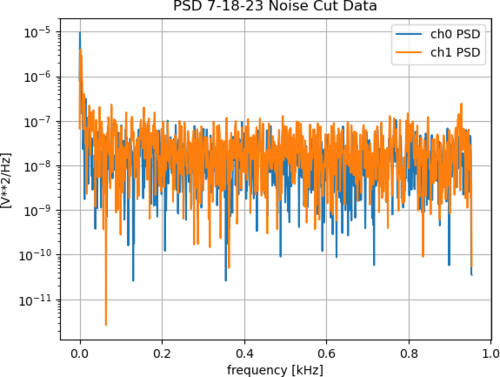
Something to note is that we have found, especially over long periods of time, the laser goes through periods of extreme noise and the signals often cross from where we set them at some point throughout our data collection. We have made the assumption that this is something to do with the laser itself, and not our setup or surrounding space because of both the times that these noise/intensity spikes took place and the duration of the spikes (1.5-2.5 hours). To try and correct for this, we have been "cutting" the noise, and just looking at sections which don't include these big fluctuations. An example of the "noise cut data" is shown in the graph titled "Signals Over Time 7-18-23 Noise Cut Data" and all of the PSD/CSD graphs have been made using only these "noise cut" regions. |
| Attachment 1: 7_14_23_cut_analyzed_graph.png
|
|
| Attachment 2: 7_14_23_raw_graph.png
|
|
| Attachment 3: 7_18_23_cut_analyzed_graph.png
|
|
| Attachment 4: 7_18_23_raw_graph_(1).png
|
.png.png)
|
| Attachment 5: 7_18_23_cut_raw_graph.png
|
|
| Attachment 6: 7_18_23_cut_just_PSD_analyzed_graph.png
|
|
|
174
|
Thu Jul 27 11:28:36 2023 |
Sophia | Update | Scripts/Programs | Update on Laser Noise Data Collection and Analysis: Dynamic CSD and PSD Plots |
| This week I have successfully been able to implement our dynamic CSD and PSD plotting code, but along the way I encountered a few challenges which I will outline in this elog post.
Challenges:
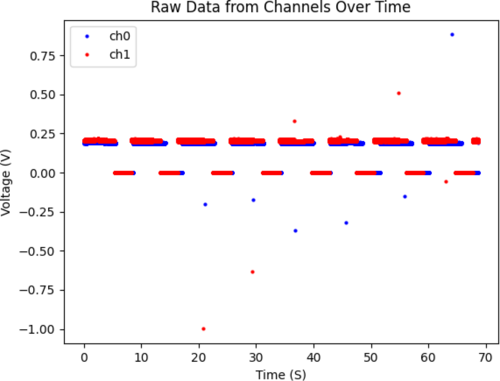
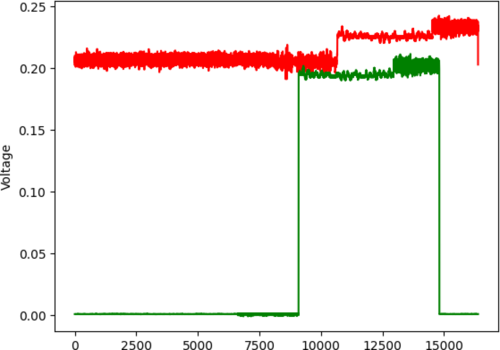
1. Once I was able to plot the data through time, I produced a graph of the raw data (shown below in the top to images) which showed pulsed data instead of a continuous stream. On Tuesday (26th of July) Tyler and I fixed this issue, realizing that calling the starting the trigger in the red pitaya was the issue. When I commented that line of code out, it immediately started plotting continuously.
2. When that issue was solved, We then started having problems with the automatically generated lines in the python program which would double back on each new iteration. I am still dealing with this issue, because the line likes to follow the progression of the data intake instead of through the plot. Currently, I am trying to plot the data as a scatter plot and then add the line as this might make it care only about the data's distribution instead of the order of the points in the list, but I am still unsure. I might try out np.sort (or some equivalent to sort the entire data set before plotting) as well. |
| Attachment 1: Screenshot_2023-07-26_at_3.02.05_PM.png
|
|
| Attachment 2: Screenshot_2023-07-26_at_1.38.47_PM.png
|
|
| Attachment 3: Screenshot_2023-07-27_at_1.36.24_PM.png
|
|
| Attachment 4: Screenshot_2023-07-27_at_1.33.01_PM.png
|
|
|
175
|
Thu Jul 27 14:11:42 2023 |
Sophia | Update | Scripts/Programs | Update on Laser Noise Data Collection and Analysis: Dynamic CSD and PSD Plots |
| Here's a screen recording of the dynamic raw data and PSD/CSD plots as they are now. Will begin working on implementing a code to generate the statistical estimator for the CSD uncertainty now. (Will talk to Tyler more about whether I can get the lines to happen or not) |
| Attachment 1: Screen_Recording_2023-07-27_at_5.08.25_PM.mov
|
|
183
|
Mon Jul 31 19:27:30 2023 |
Sophia | Update | Scripts/Programs | Update on Laser Noise Data Collection and Analysis: Dynamic CSD and PSD Plots |
| An update on the CSD/PSD code:
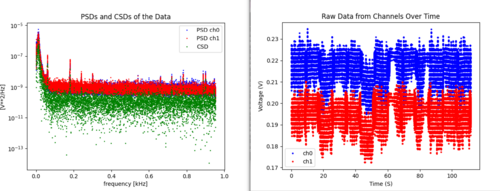
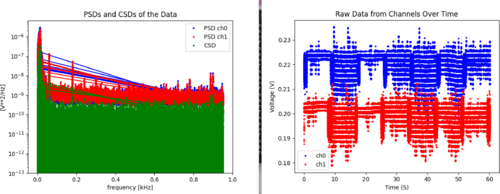
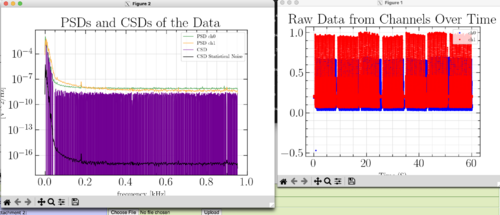
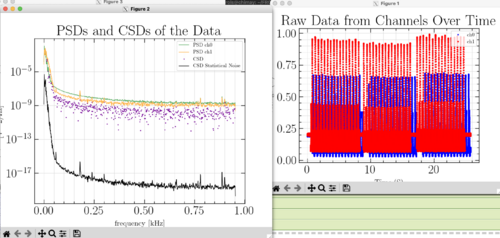
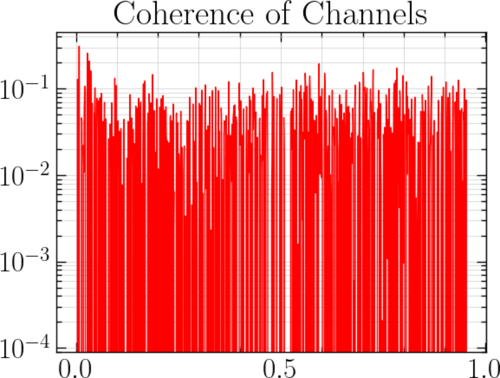
The code is now taking a dynamic average of the points, and that has significantly reduced the noise that we were reading and the issues I was having with the lines in the plots. The graph for the CSD is still putting up a fight though, and amassing many lines that do not appear when just scatter plotted. I plan to fix that tomorrow, alongside inserting my own generated signal into the data. I have plotted the coherence alongside these graphs (as shown in the first screen recording and in one of the images), and it is significantly less than 1-- starting at or below 10^(-1).
As a note, I am unsure of why the raw data looks like this-- the laser goes through periods of extreme noise and I think this data was taken during one of them. |
| Attachment 1: Screenshot_2023-07-31_at_10.18.44_PM.png
|
|
| Attachment 2: Screen_Recording_2023-07-31_at_10.16.31_PM.mov
|
| Attachment 3: Screen_Recording_2023-07-31_at_10.19.55_PM.mov
|
| Attachment 4: Screenshot_2023-07-31_at_10.21.44_PM.png
|
|
| Attachment 5: Screenshot_2023-07-31_at_10.26.34_PM.png
|
|
|
186
|
Tue Aug 1 15:44:31 2023 |
Sophia | Update | Scripts/Programs | Update on Laser Noise Data Collection and Analysis: Dynamic CSD and PSD Plots |
| We have identified two problems facing the intensity noise calculations, which we are working to solve.
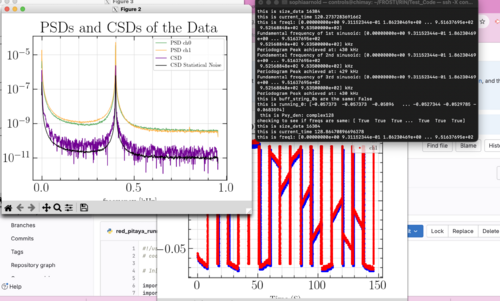
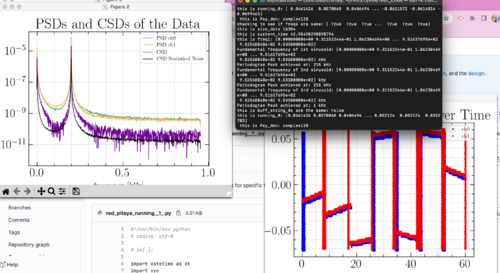
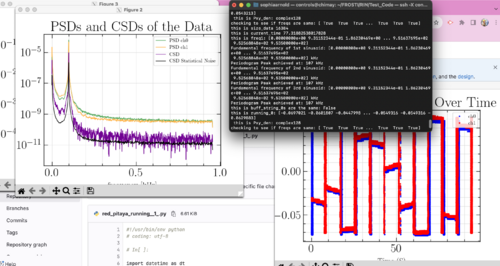
The first of these problems, is that the red pitaya appears to be taking data approximately 4 times faster than we would expect from the decimation rate based on how quickly it runs. To see if this was affecting our data, we plugged the red pitaya into a function generator. We found that my code is able to identify the driving frequency, but consistently gives predictions that are roughly 7% greater than we expect. When we drive at 100 Hz, the plot says the peak is at 107 Hz, when driven at 400 Hz, we see between 422-427 Hz, etc. While this implies that the red pitaya is not taking data at a faster rate than we would expect (if it did we would anticipate a lower than expected frequency, by a factor of roughly 4), it does imply some intrinsic issue with either the red pitaya or with the code. To fix this, I am going to use my code on artificially generated signals and see if we still observe these issues. |
| Attachment 1: Screen_Recording_2023-08-01_at_5.28.39_PM.mov
|
| Attachment 2: Screen_Recording_2023-08-01_at_5.29.46_PM.mov
|
| Attachment 3: Screen_Recording_2023-08-01_at_5.31.00_PM.mov
|
| Attachment 4: Screenshot_2023-08-01_at_5.42.53_PM.png
|
|
| Attachment 5: Screenshot_2023-08-01_at_5.44.34_PM.png
|
|
| Attachment 6: Screenshot_2023-08-01_at_5.45.35_PM.png
|
|
|
194
|
Mon Aug 7 15:36:18 2023 |
Sophia | Update | Scripts/Programs | Update on Laser Noise Data Collection and Analysis: Dynamic CSD and PSD Plots |
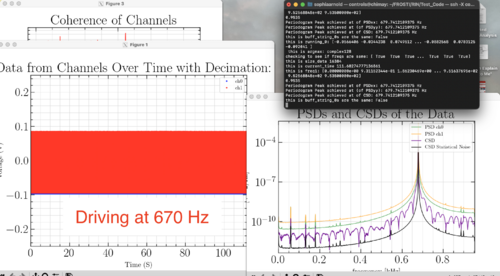
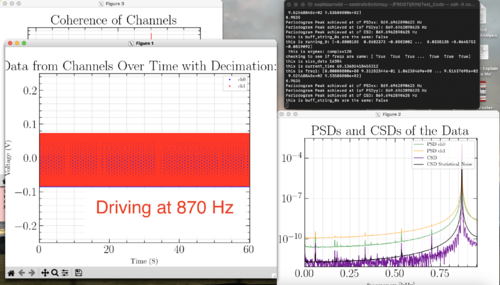
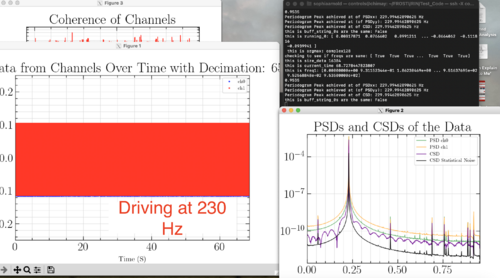
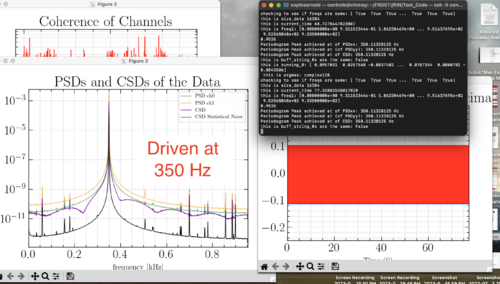
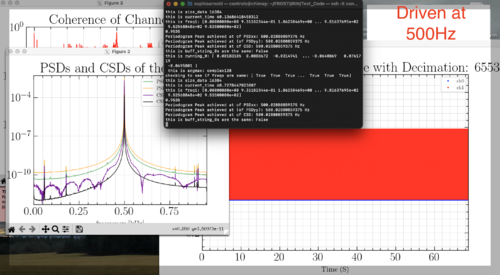
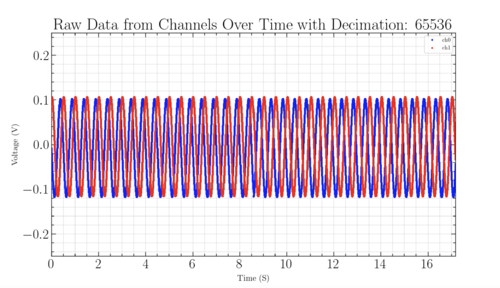
| Today I was able to fix the red pitaya's plotting problem, and get my code to recognize driving frequencies from the function generator to within a 0.5 Hz estimation. The sinusoidal plots I have included are from sending a 1 Hz signal into the red pitaya to see the signal in real time. This allowed me to see exactly where the system was messing up, and fix from the ground up. Once I had that working, I began to test sending in frequencies in the range that my PSD/CSD code could observe and I was able to identify each driving frequency within 0.5 Hz. My code was able to correctly identify a 500 Hz signal, while other analyzed frequencies in the observable range have fallen lower than the sent in frequency by a less than 0.5 Hz. I believe this issue comes from the strange speed that the red pitaya is still acquiring data, even with my fixing it to now observe a continuous signal. |
| Attachment 1: Screenshot_2023-08-07_at_6.19.44_PM.png
|
|
| Attachment 2: Screenshot_2023-08-07_at_6.16.40_PM.png
|
|
| Attachment 3: Screenshot_2023-08-07_at_6.13.47_PM.png
|
|
| Attachment 4: Screenshot_2023-08-07_at_6.06.22_PM.png
|
|
| Attachment 5: Screenshot_2023-08-07_at_6.04.28_PM.png
|
|
| Attachment 6: Screen_Recording_2023-08-07_at_5.01.54_PM.mov
|
| Attachment 7: Screenshot_2023-08-07_at_6.26.09_PM.png
|
|
|
196
|
Tue Aug 8 16:47:11 2023 |
Sophia | Update | Scripts/Programs | Update on Dynamic CSD and PSD Plots |
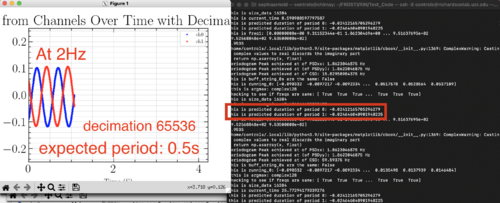
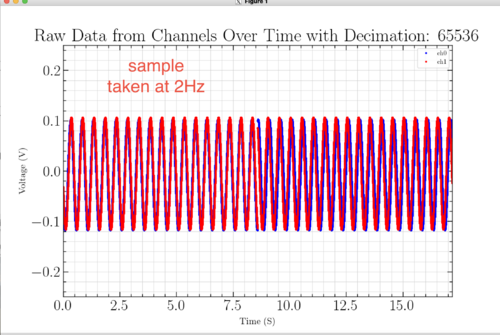
| We have fixed our rapid plotting error, and realized that this has not been affecting our data intake! Below is a video of the code progressing, alongside grabbed images of the raw data. The data is now continuous, and performs as we expect. Next, I plan to add a widget which will dynamically show the peak values instead of them just being printed in the terminal after each iteration. (Ignore the red box-- it was from me struggling with a now fixed issue). |
| Attachment 1: Screen_Recording_2023-08-08_at_7.42.30_PM.mov
|
| Attachment 2: Screenshot_2023-08-08_at_2.22.50_PM.png
|
|
| Attachment 3: Screenshot_2023-08-08_at_5.16.08_PM.png
|
|
|
206
|
Tue Aug 15 10:35:00 2023 |
Sophia | Update | Scripts/Programs | Update on Laser Noise Data Collection and Analysis: Dynamic CSD and PSD Plots |
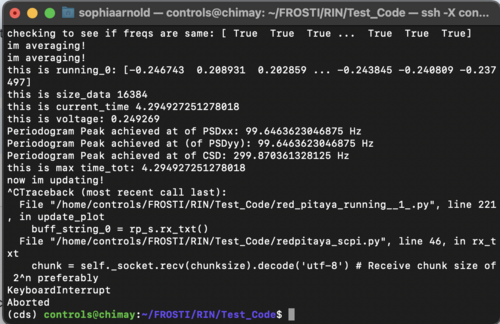
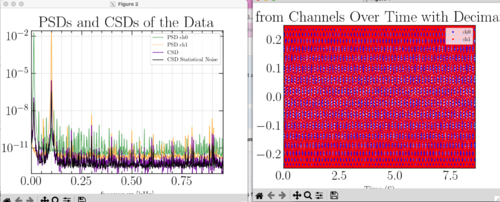
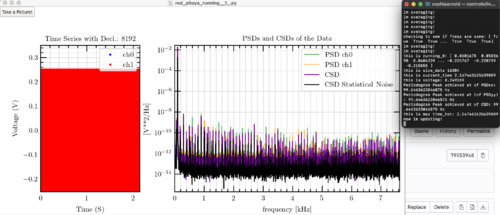
| I have successfully added a button to my graphics, but it has posed a strange issue with the CSD and PSD values. When I plot my original code, I still see the pretty peaks that I was getting originally, while my new code (as shown in the video and in the last screenshot) is giving me more of a line. In my code that gives the peak values, the CSD values also tend to fluctuate in this new code as well (shown in the first screenshot), before returning to the real value.
I think that there is a problem with the averaging and am hoping to solve this issue today with Tyler. This is good progress though! |
| Attachment 1: Screenshot_2023-08-14_at_8.18.49_PM.png
|
|
| Attachment 2: Screenshot_2023-08-14_at_8.18.43_PM.png
|
|
| Attachment 3: Screen_Recording_2023-08-14_at_8.17.50_PM.mov
|
| Attachment 4: Screenshot_2023-08-15_at_1.24.54_PM.png
|
|
| Attachment 5: Screenshot_2023-08-15_at_1.32.30_PM.png
|
|
|
207
|
Tue Aug 15 13:32:37 2023 |
Sophia | Update | Scripts/Programs | Update on Laser Noise Data Collection and Analysis: Dynamic CSD and PSD Plots |
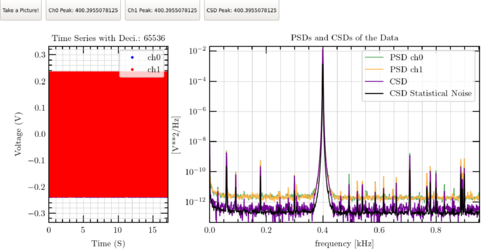
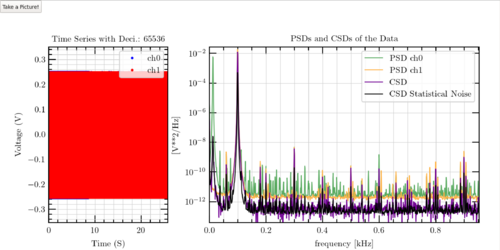
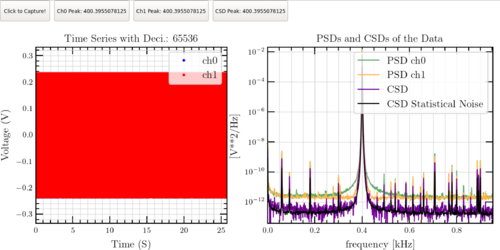
| I have now fixed all issues that I was having this morning, and have added text boxes which show the peak values of both PSD's and the CSD alongside the graphs. They also update continuously with the graph. This is shown in the top image. The laser was driven at 400Hz, and had 0.5V peak to peak voltage, both of which appear correctly in the below graphs.
Now that the code is almost fully working (we will finish debugging the screenshot method later today), our plan tomorrow is to drive the laser and see how the code performs with it. The below graph is from us driving the function generator at 100Hz to test the range.
Update:
Bottom graph is new version of graphs with better distribution of both graphs. |
| Attachment 1: Screenshot_2023-08-15_at_4.27.58_PM.png
|
|
| Attachment 2: Screenshot_2023-08-15_at_2.21.18_PM.png
|
|
| Attachment 3: Screenshot_2023-08-15_at_5.25.05_PM.png
|
|
|
249
|
Mon Oct 30 11:03:56 2023 |
Tyler | Update | Scripts/Programs | |
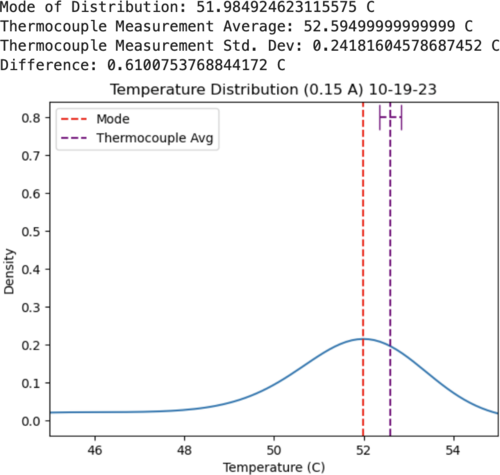
FLIR: After some adjustments, the plot generated from the FLIR measurements look much more symmetric (see attachment). There are more included grid points, which smooths out the curve as compared to last week.
Red Pitaya: It looks like a new OS update was released for the RP, which includes a new Python API (was previously only available in C). I'm going to try and update the one we have currently running in lab.
|
| Attachment 1: Screenshot_2023-10-23_at_12.39.05_PM.png
|
|
|
317
|
Tue Feb 6 22:40:25 2024 |
Michael | Update | Scripts/Programs | Long Crab 1 Design Created In Gtrace |
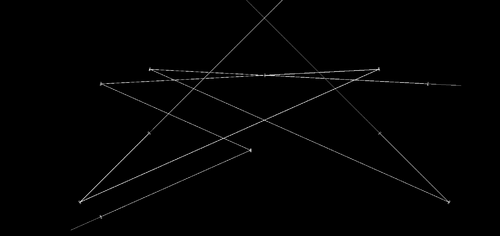
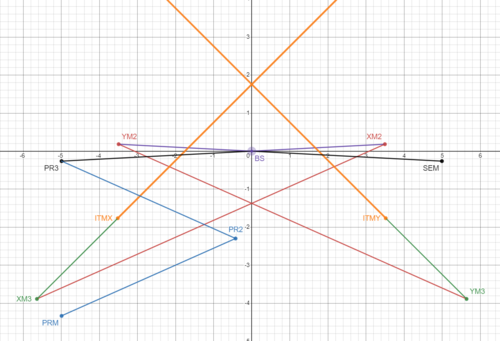
| Worked on and completed the python code for the simulation of the Long Crab 1 layout for Cosmic Explorer basing off of Pooyan's original work with the Crab 1 layout. From here I'll look into creating the shoelaces layouts. |
| Attachment 1: Long_Crab1.png
|
|
| Attachment 2: long_crab_1_desmos.PNG
|
|
|
376
|
Fri Jun 14 13:32:13 2024 |
Liu | Update | Scripts/Programs | COMSOL simulation on rectangular heater elements design |
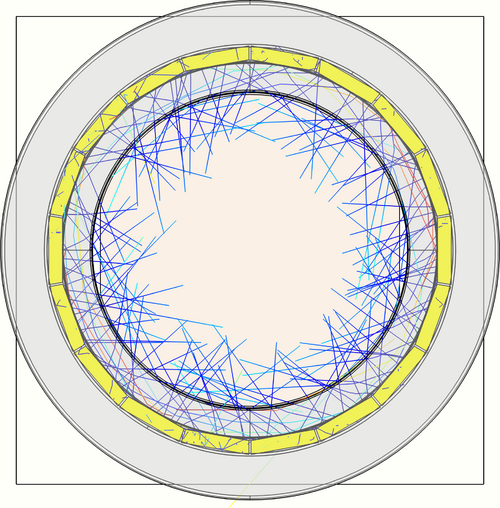
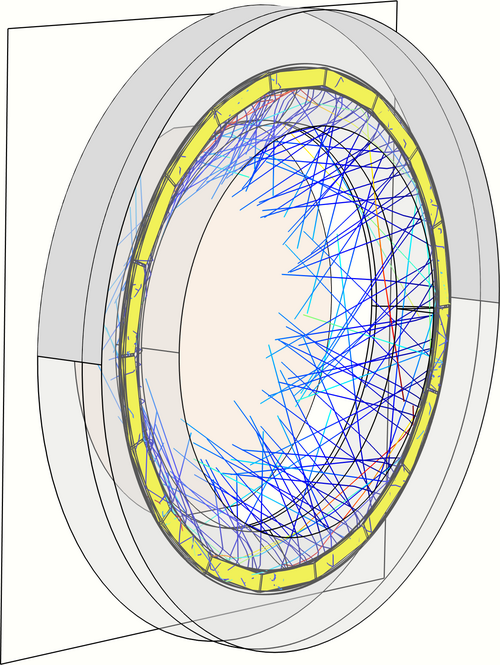
I have been looking at the feasibility of an alternative heater element design for FROSTI that replaces the original ring-like heater elements with n rectangular elements with straight edges. They form an n-sided regular polygon that could well approximate the original annular ring if n is large enough. This eliminates curved surfaces requirement for the heater elements, which was the source of the many month production delay for the prototype parts.
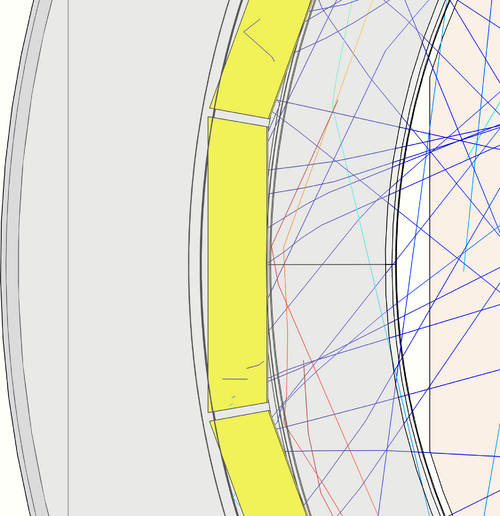
This design was implemented in COMSOL, shown in the attached. From the face on view, each element has a trapezoid shape with straight edges. The edges between neighboring elements are parallel, with a space of 2 mm in between them.
The ray tracing and thermal analysis obtained from COMSOL are shown in the attached pdf.
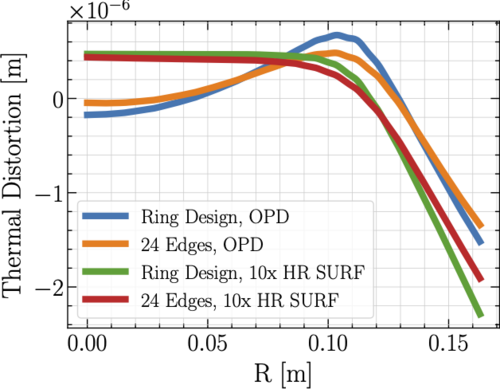
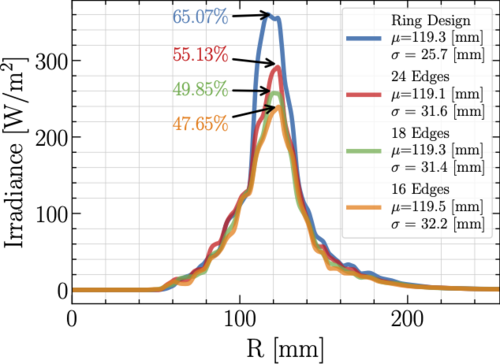
In particular, the 2D irradiance profiles were obtained from the ray tracing (so far from the front heating surfaces only). The 1D radial profiles were integrated and shown in the attached. The power delivery efficiency for the original ring-like heater element design is integrated to be roughly 65%, for comparison. The plot also shows the radial irradiance profiles for three different straight-edge designs, which correspond to 16 edges, 18 edges, and 24 edges. We see that with the straight-edge designs, the irradiance profiles stay in a good Gaussian shape. In addition, with a larger number of edges, the power efficiency increases, but is always less than the case for the optimized ring-like design.
The thermal distortions for the TM were also obtained from COMSOL, using the irradiance profiles at the TM HR. As shown in the attached, with the straight-edge design, the effects on the thermal lens OPD and the HR surface deformation are similar to the ring design, but with less severe edge roll-off for instance. |
| Attachment 1: rayIllu_full.png
|
|
| Attachment 2: rayIllu_side.png
|
|
| Attachment 3: rayIllu_zoom.png
|
|
| Attachment 4: thermal_distortions.png
|
|
| Attachment 5: results.pdf
|

|
| Attachment 6: Irradiance_profile.png
|
|
|
380
|
Fri Jun 21 11:47:30 2024 |
Liu | Update | Scripts/Programs | COMSOL simulation on alternative straightened heater elements design |
In the previous post, we saw that for the heater element design with straight edges in replacement of the current eight-element ring-like design, it provides the similar Gaussian-like irradiance profiles, but with smaller power delivery efficiencies, as shown in the plot. This turned out to result in similar but less prominent thermal effects.
They only differ from the original baseline design by a source power rescaling, however, as shown in the plot, where we see the power-rescaled irradiance profiles for the straight edge designs are close to that for the ring design. The resulting temperature profiles and thermal distortions are shown in plot and plot. The thermal effects for the 16 straight-edge design with renormalized source power for instance are strikingly similar to that for the original ring design.
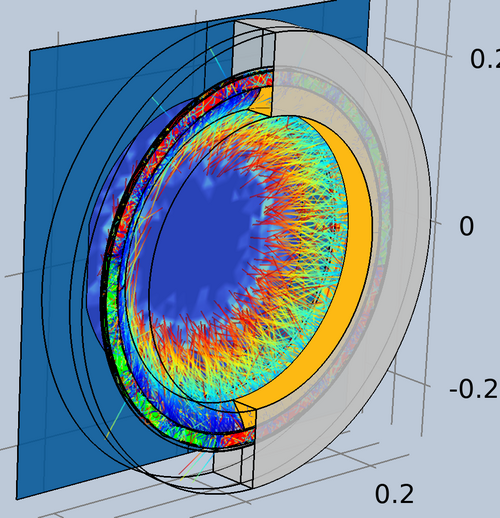
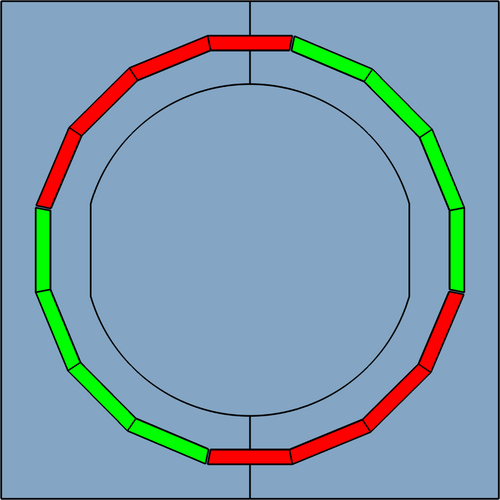
An alternative straightened heater element design has also been investigated with COMSOL FEA simulation. As shown in the attached, in this new design each heater element component is cut with multiple straight edges but remains connected, shown in the same colors (green and red). In the example, four straight edges are cut from each of the four heater components (4x4=16 edges in total). There is no spacing between the neighboring edges from the same element component, but the edges from different components are separated by 2mm, as can be seen in the attached. This new N-in-one straight edge design offers similar irradiance compared to that for the evenly-spaced N-sided regular polygon straight edge design with the same number of edges, as shown in the plot. It however has fewer heater components, four in this case, which makes it easier to implement in assembly and wiring, and less vulnerable to electrical and thermal shorts with their fewer heater element pins. |
| Attachment 1: rayIllu_side_new.png
|
|
| Attachment 2: rayIllu_full_new.png
|
|
| Attachment 3: Irradiance_profile.pdf
|

|
| Attachment 4: Irradiance_profile_norm.pdf
|

|
| Attachment 5: temp_profile.pdf
|

|
| Attachment 6: thermal_distortions.pdf
|

|
|
387
|
Thu Jun 27 11:09:14 2024 |
Liu | Update | Scripts/Programs | Straight edge STEP files and ray loss analysis |
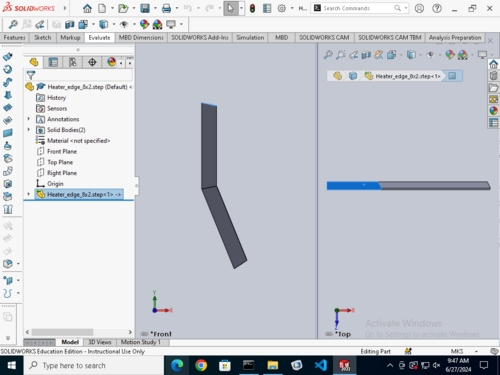
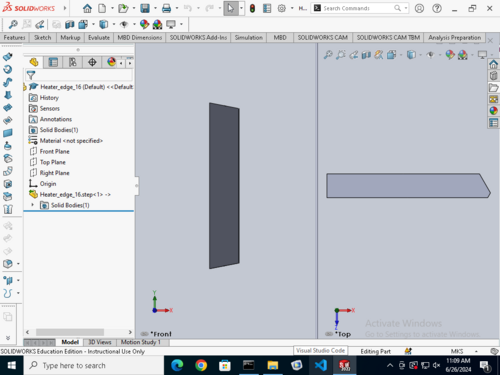
Drawings and CAD models of the straight-edge designs are exported, and are visualized in SOLIDWORKS. Two are attached. One is a single edge of the evenly spaced polygon design with 16 edges, and the other is the 8x2 design, with two neighboring edges grouped together to replace the original single curved heater.
For the straight edge design in COMSOL, ray power detectors were placed at the heater's front surface. The irradiance is shown in figure. The amount of light rays deposited back to the heater is small when close to the center, where it is closer to the original ring. The ray power increases as we move further away from the center toward the edges. In addition, the total power integrated at the heater's front surfaces is about 21% of the original heater's emitted power. This could account for the power efficiency difference between the straight edge design and the ring design, as shown in plot for instance. |
| Attachment 1: edge_CAD_8x2_step.PNG
|
|
| Attachment 2: edge_CAD_step.PNG
|
|
| Attachment 3: Irradiance_frontheater.png
|

|
| Attachment 4: Irradiance_profile.pdf
|

|
|
447
|
Mon Sep 23 15:11:21 2024 |
Tyler | Update | Scripts/Programs | Effective Emissivity Analysis and RIN Update |
A quick update on the effective emissivity analysis for the CIT FROSTI testing:
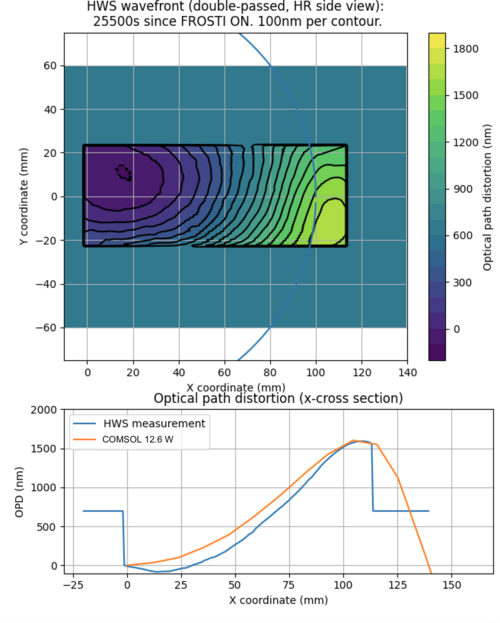
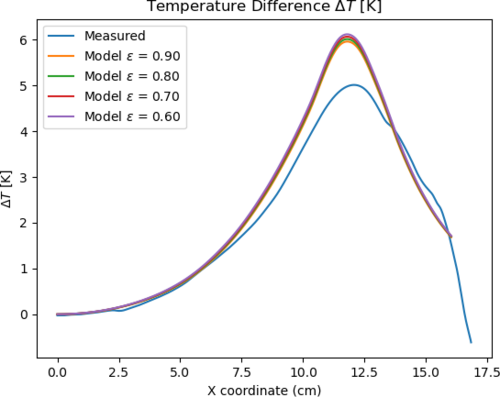
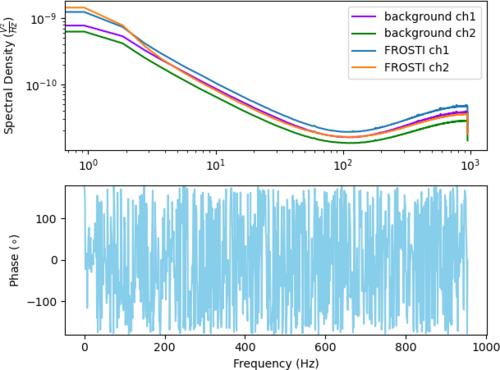
I was able to (roughly) match the OPD data to a referenced COMSOL model, with an applied power of 12.6 W (as seen below). However, when changing the emissivity of the ETM in COMSOL, the dT profiles do not seem to change much. I am not sure as to why this is the case at the moment, and will continue to look further.
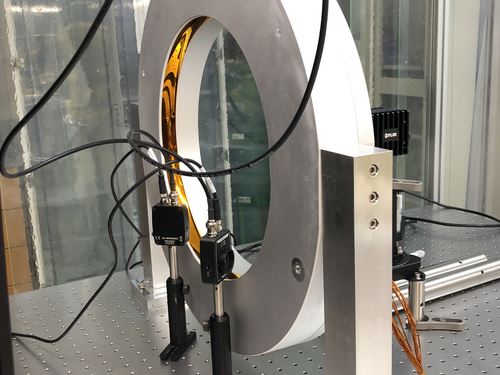
Additionally attached are the current RIN measurements of the FROSTI prototype. Shown is the PSDs of both channels, in reference to their individual backgrounds.
|
| Attachment 1: OPD_Plot.png
|
|
| Attachment 2: Temp_emiss_plot.png
|
|
| Attachment 3: rin_photodectors.png
|
|
| Attachment 4: RIN_setup.jpg
|
|
|
521
|
Sun Feb 23 16:00:07 2025 |
Luke | Update | Scripts/Programs | Ringheater modeling Update |
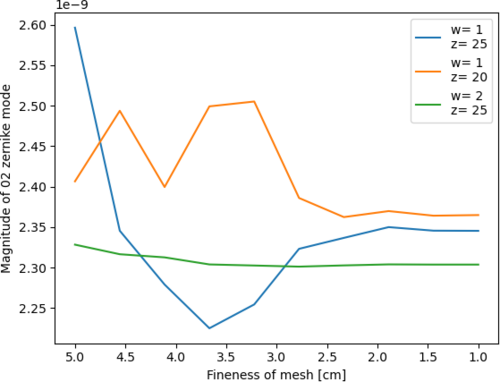
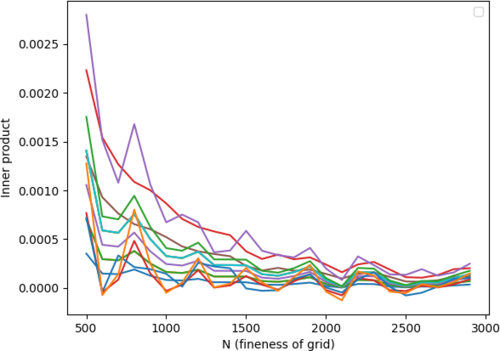
These are some plots:
The first shows the convergence of the 02 mode reducing the size of the mesh. The second shows the the numerical error of the zernike.
The first is found by sweeping a parameter that changes the size of the mesh. The HR surface was set to half a cm for all values.
The second by taking the inner product of a zernike mode with its self and calculating its deviation from pi for varying fineness of the mesh. |
| Attachment 1: mesh_convergence.png
|
|
| Attachment 2: numerical_error_in_innerproduct_of_zernike_basis_elemets.png
|
|
|
541
|
Sun Mar 23 15:39:06 2025 |
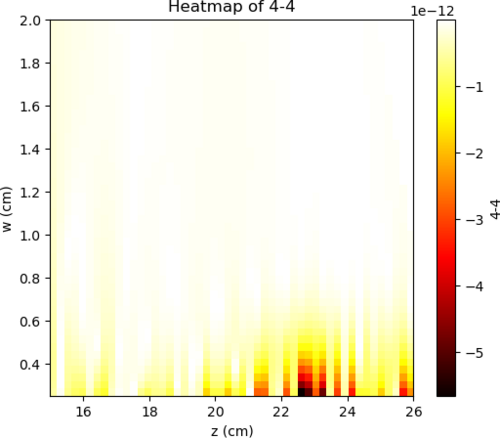
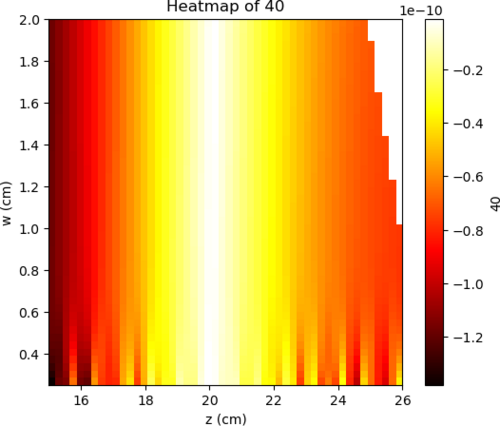
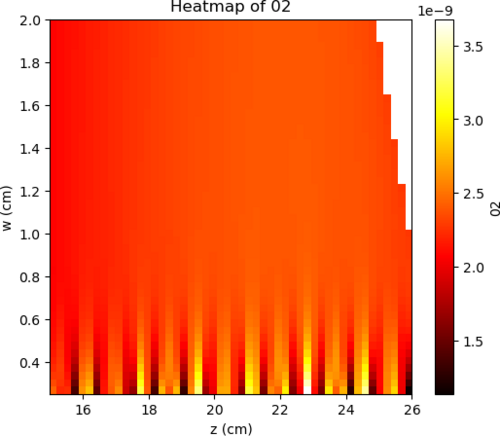
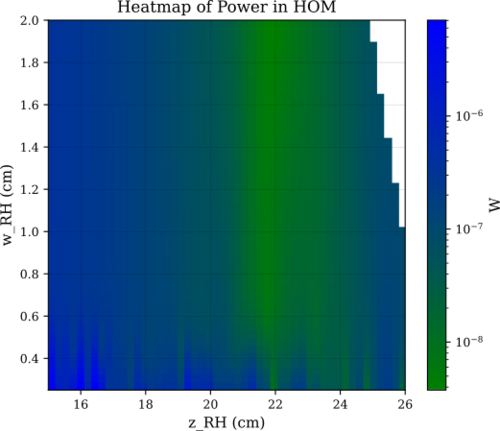
Luke Johnson | Update | Scripts/Programs | Ringheater Location optimization |
| Attached are some plots that show a new parameter sweep with a finer mesh then before. I have also been able to get a heatmap of power of HOMs in a very simple finesse model. |
| Attachment 1: _4-4.png
|
|
| Attachment 2: _40.png
|
|
| Attachment 3: 02.png
|
|
| Attachment 4: HOM_power.svg
|
|
|
543
|
Mon Mar 31 11:26:45 2025 |
Luke Johnson | Update | Scripts/Programs | Heatmaps of power delivery performance |
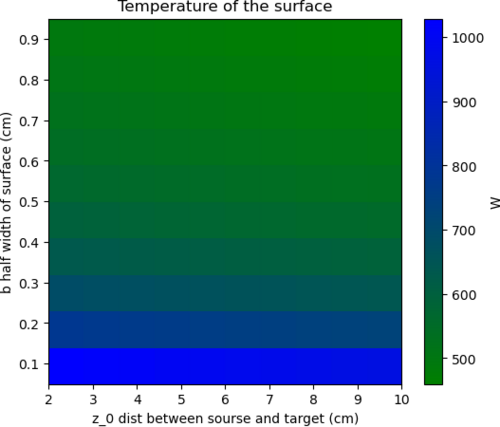
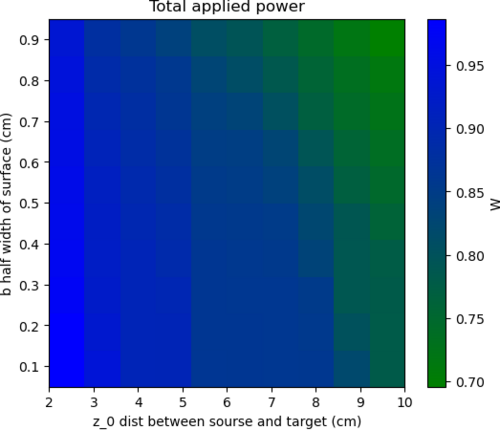
| These plots show the required temperature to release 100W of power and the efficiency of a particular configuration with half-width w and distance away from the barrel z. I want to add to these heat maps a limit line that has restricts the proximity of the reflectors from the barrel. |
| Attachment 1: temp_required.png
|
|
| Attachment 2: efficiency.png
|
|
|
550
|
Tue Apr 8 12:15:59 2025 |
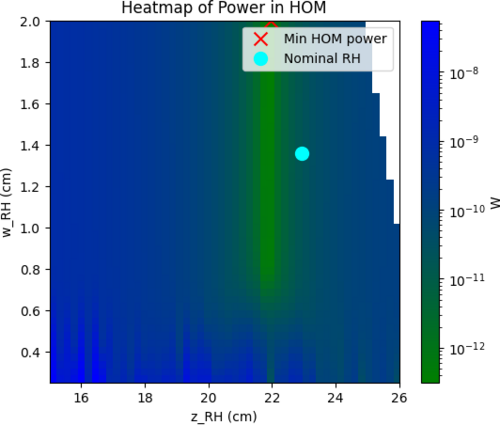
Luke | Update | Scripts/Programs | Updated optimization plot |
|
| Attachment 1: HOM_scattering_w__nominal_and_min.png
|
|
|
557
|
Tue Apr 22 08:00:39 2025 |
Luke | Update | Scripts/Programs | Thermal optimization modeling 40kg |
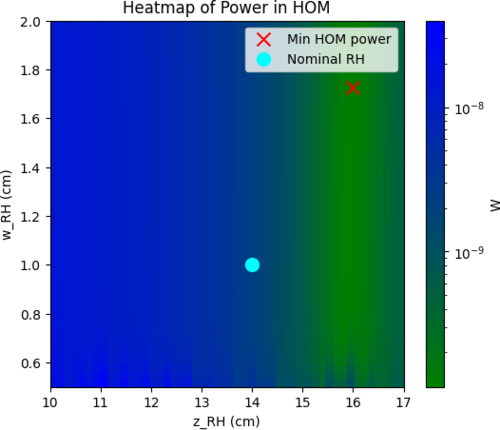
I have redone the width and location optimization with a 40kg test mass. This was to see where the nominal ring heater would fall in this optimization map see attached.
There are two concerns I have with this modeling:
- I am using normalized power only imparting 1W, which may effect the single pass scattering used for optimization.
- I am only looking at the surface deformation and I believe that looking at OPD may also be something that is important to consider.
Note z_RH is measured from the HR surface and w_RH is the half width of the target plane |
| Attachment 1: 40kg_into_HOM.png
|
|
|
561
|
Fri Apr 25 09:09:03 2025 |
Luke | Update | Scripts/Programs | Update to optimization plots |
| I have calculated the curvature of the surface plots and created a heat map out of the data. I have also created a contour plot of them together. It is very rough and the artifacts at small w make it hard to read. I am planning on excluding that data and replot them. In the meantime I have created a temporary function that balance the two values. (log_10(curvature/HOMscattering))
|
| Attachment 1: HOM_scattering_100kg_modified.png
|
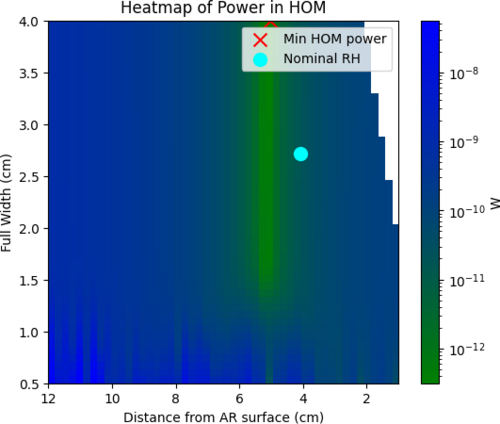
|
| Attachment 2: curvature_100kg.png
|
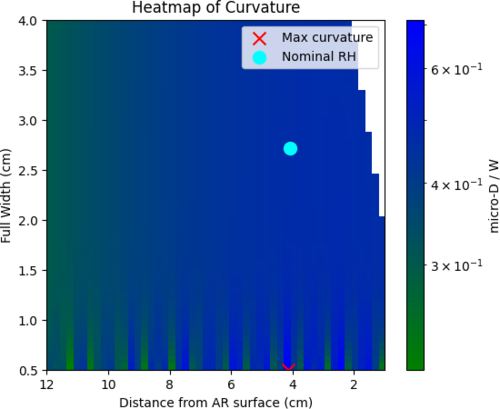
|
| Attachment 3: initial_contour_plot_with_hom_and_curvature.png
|
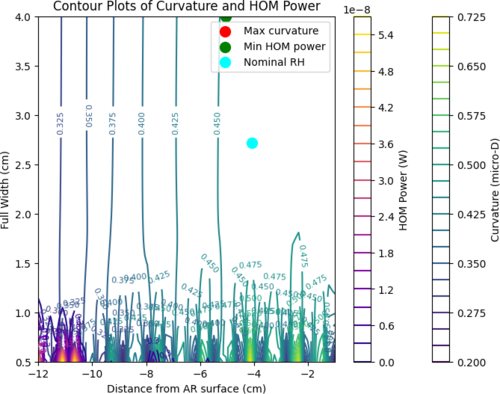
|
| Attachment 4: temp_quality_(log10_ratio).png
|
.png.png)
|
|
562
|
Fri Apr 25 19:18:10 2025 |
Luke | Update | Scripts/Programs | New optimization plots |
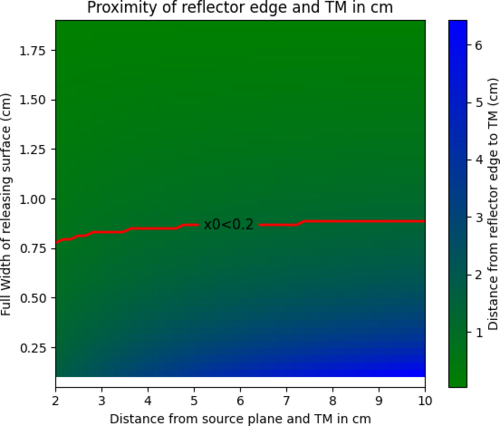
I have created two more plots. One on the transmitted power for a specific configuration. This was done by taking the product of the efficiency and the power released by surface area of the source plane for a configuration assuming it is at 300C. The second is a plot of how close the reflector is to the test mass I have included a contour line at 2mm the nominal proximity constraint. Both of these plots are generated for a 2cm wide target plane.
Somethings of note: Because the proximity requires no modeling and can be determined purely mathematically it is easy to re-generate this plot of other target widths. If you increase the target width the proximity contour moves upward and downwards if reduced. |
| Attachment 1: effective_power.png
|
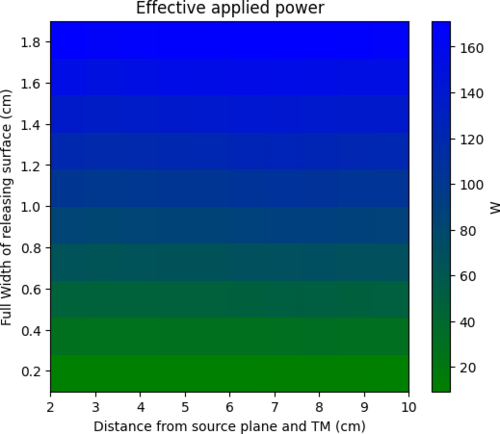
|
| Attachment 2: proximity.png
|
|
|
569
|
Sun May 4 18:17:45 2025 |
Luke | Update | Scripts/Programs | Ringheater modeling Update |
Slides
I have changed some properties of the thermal model and am re-running the thermal sweeping
I have also been messing around with making a logo |
|
575
|
Sun May 11 19:36:42 2025 |
Luke | Update | Scripts/Programs | New optimization plots |
Slides
I have re-run the optimization plots with the changes mentioned last week.
I have added the heat maps of the HOM scattering from HR deformation and the HOM scattering due to the OPD difference as well as the curvature actuation of the surface. |
|
581
|
Mon May 26 11:15:28 2025 |
Luke | Update | Scripts/Programs | Update to optimization plots |
| I have created some new optimization plots. I have also started on a model like the previous Desmos model, but in python.
Slides |
|
584
|
Mon Jun 2 09:45:06 2025 |
Luke | Update | Scripts/Programs | Ringheater modeling Update |
Slides
I have added some slides to my meeting updates. The updates include: my choice in position and width, some figures I have added to my write up, and what I think my immediate steps are to wrap up.
I have also made a new FROSTI model that conducts its raytracing in real time. Something that was severely lacking in the previous model. |
|
134
|
Tue Jun 27 14:04:42 2023 |
Sophia A. | Update | Measuring Noise in Interferometer | Interferometer set up and connection to red pitaya |
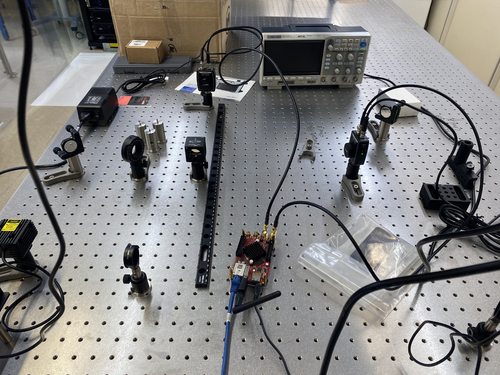
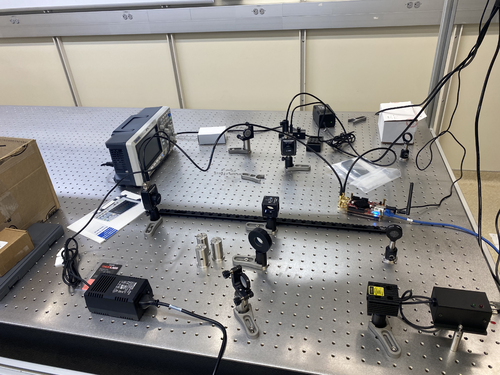
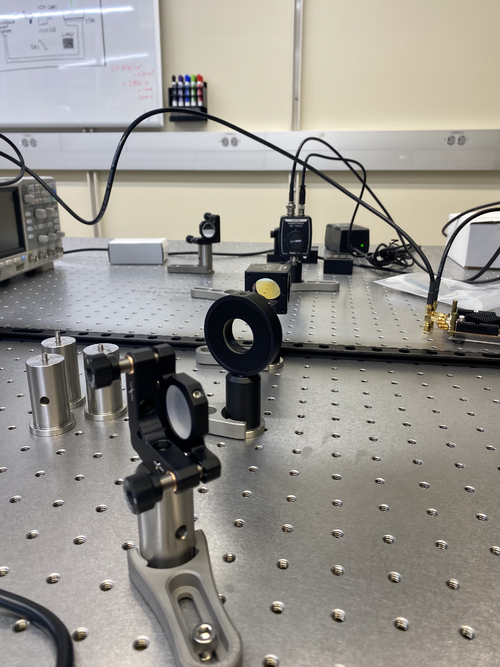
| Today we (Sophia and Tyler) constructed the set-up for the electrical noise calculation that I will be conducting this summer. I have included images of the setup below. Our system is effectively a green laser, that feeds into a type of polarizer, then into a beam splitter which sends the laser light down two arms into detectors. We started by connecting the detectors to an oscilloscope to determine whether the signal will exceed 1V, as the red pitaya (our planned data collection device) cannot receive signals with a higher voltage than 1V. We spent most of our time calibrating the oscilloscope and fine-tuning the set-up so that we would have approximately equal voltages in each arm of the interferometer. Once confirming that the output voltage would not meet or exceed 1V, we switched from an oscilloscope to the red pitaya for our measurements. Now that the system is set up, we will be able to run code in the red pitaya interface that will run an FFT on the signal, and then do noise analysis from there. |
| Attachment 1: IMG_6756.jpg
|
|
| Attachment 2: IMG_6754.jpg
|
|
| Attachment 3: IMG_6755.jpg
|
|
|
656
|
Thu Oct 23 11:09:16 2025 |
Xuesi Ma | Update | Measuring Noise in Interferometer | Scatter Noise Model |
DetChar meeting presentation |
|
10
|
Wed Aug 17 16:04:30 2022 |
Phoebe Zyla | Summary | Lore | Testing the Cartridge Heater and Collecting FLIR Data |
We have tested the heater to find emissivity, mounted the heater system to the optical table, and have taken irradiance maps of the heater projected onto the screen.
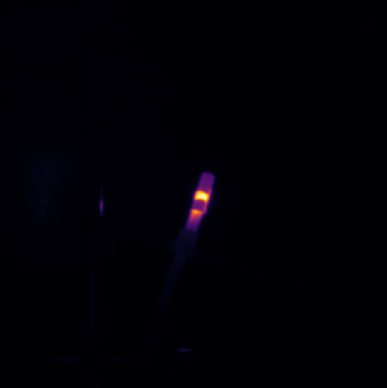
The heater's emissivity was determined by using a thermocouple in conjunction with the FLIR's temperature calibration. To attach the thermocouple to the heater initially, I used Kapton tape and ran both the wires of the heater and the thermocouple through the heater bridge. This allowed for the heater to rest on an optical post and be observed without anyone directly holding it, but there were some measurement issues. The thermocouple had a very wide range of temperatures it was reading, which may have been due to intermittent contact or a short between the two legs of the thermocouple. To solve this and make the temperature measurements more stable, we pried apart the two ends of the thermocouple (to ensure there was no short) and put tape on either side, leaving the end connection bare. This was then taped to the heater, and the thermocouple was much more stable. We also used a K-type thermocouple that has an adhesive tape on it already, which assisted with the intermittent contact as well. With the thermocouple measuring the temperature of the heater, we could point the FLIR directly at the heater and calibrate the emissivity until the FLIR and the thermocouple agreed. Cassidy's emissivity calculator was also used, as I could input a temperature and observe what the emissivity of an area was based on that temperature. We found the emissivity of the heater to be 0.57.
As a note, when observing the heater with the FLIR, it appeared that there was a hot spot in the center, where the Kapton tape sat. Because the Kapton has a different emissivity than the 304 stainless steel of the heater, the FLIR will read it as having a different temperature than it actually does. When using the FLIR in the future, be sure to ascertain whether there is a temperature difference somewhere or if there may be different emissivities.
Additionally, the first heater that I used was taken to a very high temperature and oxidized. The emissivity of this oxidized heater is not known, but could be good information for knowing how oxidation affects these heaters specifically.
To mount the heater system in front of the screen, I used 1/2'' optical posts and the mount I designed using COMSOL's CAD program. The heater was originally 2.5 inches away from the screen, and has since been moved back by an additional two inches so that we could observe the heater side of the screen with the FLIR. We wanted to see what temperature the heater side of the screen was when irradiated by the heater, and how that compared to the camera side of the screen. When the heater ran at 1.12 W of input power, the heater side of the screen had a max temperature of around 29.7 C, and the camera side of the screen read at about 29.5 C. This means that there is very little thermal loss between the two sides of the screen, and any insulation that the screen's adhesive may have is largely negligible. Additionally, the camera was placed at an angle and undetermined distance for these tests, confirming that the temperature measurements compensate well/donít depend on changes in angle or distance between the camera and the screen. However, there was spots on the back of the screen that the camera was measuring as hot spots where there shouldnít have been any. I have included an example below. It would be useful to run a test where the camera is directly on the back of the screen without the heater to characterize the screen and see if the hot spots are physically present on the screen or if this is an artifice of the camera because of something like angle of viewing.
Taking irradiance maps of the screen was straightforward. After checking that the emissivity of the screen is 0.99 by viewing it at room temperature, we monitored the max temperature while slowing increasing the wattage the heater was running at. There is not a large change until the heater is at around 95 C, at which point the screen began to rise in temperature from 27 C to 28 C. We took measurements of this while the heater was 2.5 and 4.5 inches away from the screen. The irradiance map has a very symmetrical and circular shape, but does not have the ring pattern that we expected. There may be a few reasons for this: there could be some conduction between the two sides of the screen that is causing the pattern to spread further, the heater setup may not be as ideal as it was modeled to be, or there could be a different, unknown issue.
TO DO:
- It would be useful to run a test of the camera in multiple different positions to ensure our conclusion that the cameraís measurements donít depend on angle or distance (or that these factors are well accounted for in the current temperature calculations) is correct.
- Measure the back of the screen straight on to identify bright spots and possible reasons as to their appearance.
- Recalibrate camera to ensure it is still correct after testing in multiple positions.
- Take another irradiance map of the screen at a higher input power, as well as moving the heater close/further away to try and replicate the COMSOL irradiance maps. It would be useful to also redo the COMSOL modeling at lower powers and variable distances.
Pictures included of full table setup, the heater mount, the heater with Kapton tape attaching the thermocouple as well as FLIR's measured irradiance map. |
| Attachment 1: Screenshot_(74).png
|
.png.png)
|
| Attachment 2: Screenshot_(75).png
|
.png.png)
|
| Attachment 3: Screenshot_from_2022-08-15_11-24-40.png
|
|
| Attachment 4: AcquisitionImage(Aug-15-2022_14_16).jpg
|
.jpg.png)
|
|
274
|
Tue Nov 21 14:47:24 2023 |
Tyler | Update | Lore | 1129 Workbench Assembly Update 1 |
[Tyler, Shane, Mohak, Cynthia, Luke, Michael, Luis]
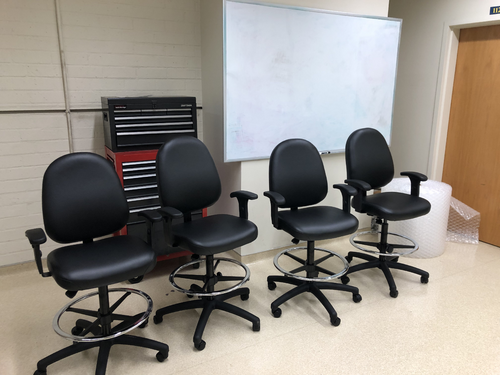
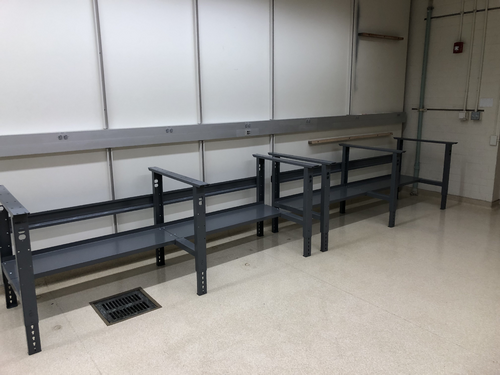
Started assembly of the workbench equipment today. We completed the stools, and have constructed the frames of each workbench. All that needs to be added are the tabletops and the top shelves, which will be done on Monday. |
| Attachment 1: IMG_7569.jpg
|
|
| Attachment 2: IMG_7568.jpg
|
|