| ID |
Date |
Author |
Type |
Category |
Subject |
|
12
|
Mon Nov 28 18:10:23 2022 |
shane | Update | ELOG | Particle counts in the clean room |
| Particle count stats for the clean room Nov 28, 2022:
Took 10 sample runs in each of 5 regions in the clean room (5 runs per region with a person inside the clean room for the measurement, and 5 runs per region without anyone in the clean room for the measurement), for a total of 50 samples taken. Sample time was 60 seconds. Overall clean room average particle count for the size ranges are as follows:
0.3 micrometers- 3405.76 (room occupied), 974.92 (room empty)
0.5 micrometers- 409.72 (room occupied), 409.72 (room empty)
1.0 micrometers- 1102.2 (room occupied), 282.6 (room empty)
2.5 micrometers- 692.32 (room occupied), 183.68 (room empty)
4.0 micrometers- 254.28 (room occupied), 84.72 (room empty)
5.0 micrometers- 141.24 (room occupied), 84.72 (room empty)
7.0 micrometers- 56.48 (room occupied), 84.72 (room empty)
10.0 micrometers- 42.36 (room occupied, 42.36 (room empty)
More statistics (including individual stats on the 5 regions within the clean room) attached. |
| Attachment 1: clean_room_particle_counts_11_28_-_Sheet1.pdf
|

|
|
19
|
Fri Feb 3 13:04:04 2023 |
shane | Summary | General | clean room particle counts 1/25/23 |
| Clean room count graphs for each zone (as of January 25, 2023) attached |
| Attachment 1: cleanroomcountsJan25.pdf
|

|
|
71
|
Wed Apr 12 16:17:50 2023 |
shane | Update | General | Particle Counter moved |
| With the added height of the new docking station, the particle counter no longer fits under the Windows monitor in the electronics rack and has been moved to the desk in the corner of the lab. |
| Attachment 1: IMG_6693.HEIC
|
|
178
|
Fri Jul 28 13:39:39 2023 |
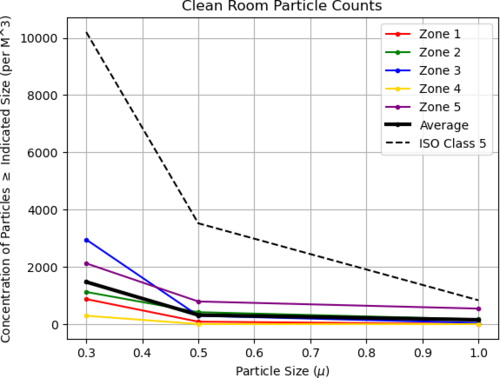
shane | Update | Cleanroom | full 5 zone cleanroom particle count |
| Here's the 5 zone cleanroom measurement from today. |
| Attachment 1: download.png
|
|
|
193
|
Mon Aug 7 13:58:46 2023 |
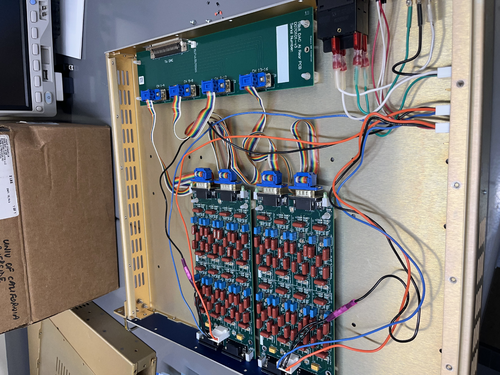
shane | Update | CDS | internal power supply cables done for AI chassis |
| Finished assembling and installing the aLigo chassis internal power supply cables in the anti-imaging chassis today. Tested for continuity and everything looked good. Chassis lid still secured with two temporary screws because I'm not sure what the correct size is. |
| Attachment 1: IMG_8674.jpeg
|
|
|
260
|
Thu Nov 9 19:06:46 2023 |
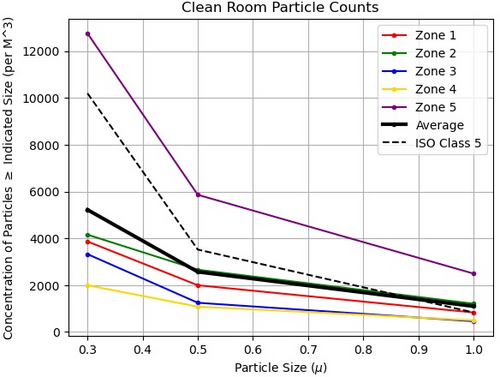
shane | Update | Cleanroom | 5 zone cleanroom measurement |
| Here's today's five zone measurement, taken ~5 hours after the cleaning. Zone 5 (closest to fire cabinet and back wall) is a bit over the limit in all size ranges (about 1500 particles in 1.0u size range over), and zone 2 is slightly over the limit in the 1.0u range, but everything else is under the requirement. |
| Attachment 1: 23.jpeg
|
|
|
262
|
Fri Nov 10 14:16:04 2023 |
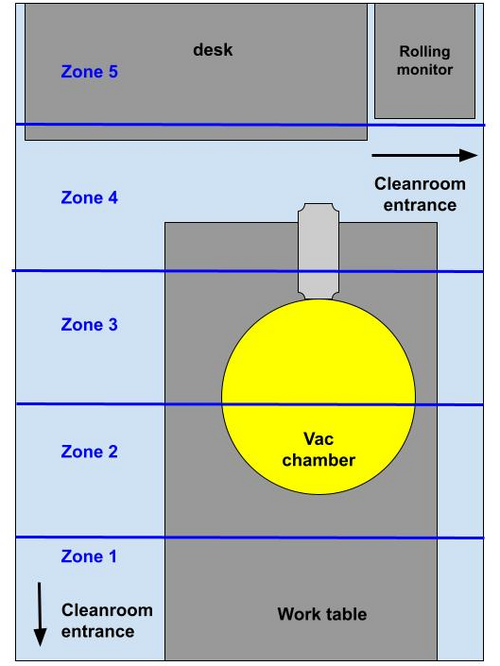
shane | Update | Cleanroom | new cleanroom zone diagram |
| since the vac system has been moved and made permanent, here's a new diagram of the cleanroom zones. The zones themselves haven't moved, but the diagram has been updated to reflect the new set up of the cleanroom. |
| Attachment 1: cleanroom_zones_nov2023.jpg
|
|
|
309
|
Thu Jan 18 18:06:49 2024 |
shane | Update | Cleanroom | cleanroom 5 zone particle count measurement |
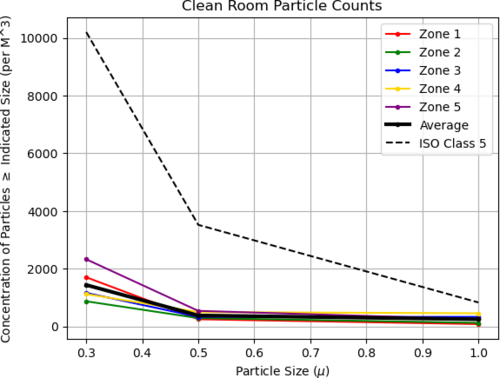
| Here's today's full five zone measurement of the cleanroom |
| Attachment 1: 24.png
|
|
|
315
|
Fri Feb 2 19:18:24 2024 |
shane | Update | Cleanroom | cleanroom cleaning and particle count |
|
[Aiden, Shane, Luis, Luke]
cleaning cleanroom and particle count
|
|
318
|
Wed Feb 7 12:43:22 2024 |
shane | Update | Cleanroom | cleanroom particle counts (full 5 zone measurement) |
| Here's today's full 5 zone measurement of the cleanroom. Everything is back under the requirement. |
| Attachment 1: 24.png
|

|
|
365
|
Tue May 7 20:34:31 2024 |
shane | Update | CDS | frosti MEDM screen update |
| [Luis, Shane]
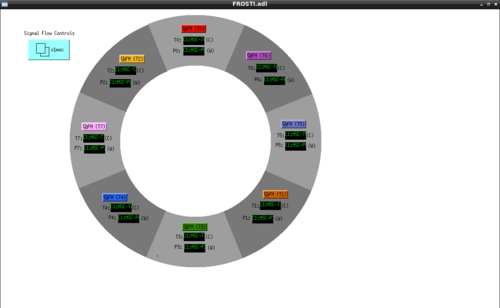
Here is the updated MEDM screen, with new orientation and updated labeling to reflect the actual positions of the heater elements. Note that indices start at T0 to be consistent with simulink model, though in the previous elog for the FROSTI layout the heater elements are labeled 1-8.
Also, we finally learned how to take a screenshot on debian. |
| Attachment 1: FROSTIMEDMMay7.2024.png
|
|
|
505
|
Tue Jan 28 13:30:46 2025 |
shane | Update | CDS | Serial comms testing update |
| Attempted to communicate with the smaller vac pump (TwissTor 74) via Agilent software today. Was able to communicate with the pump via python serial connection code as usual, with no issues. When using the manufacturer software though, it was unable to 'locate' the pump and failed to connect to it. So manufacturer software works for the big (older) pump, but not the smaller, newer one. Unclear if this is somehow related to the fact that using the manufacturer software for the bigger pump involved manually connecting its controller to spica with a db9, and there was no obvious way to do that for the smaller pump's controller. |
|
546
|
Thu Apr 3 13:23:37 2025 |
shane | Update | CDS | UPS interfacing |
| Update on UPS serial interfacing: the driver for the UPS webcard has been installed on spica (for UPS1 in room 1119) and logrus (for UPS2 in room 1129). Static IP addresses have been assigned for both and noted on the lab wiki. Neither is yet able to connect, as the initial ip address webpage connection test failed for both. In the process of troubleshooting now. |
|
451
|
Wed Oct 2 10:31:46 2024 |
Xuesi Ma | Configuration | | Group Meeting Slides 10/2/2024 |
Group Meeting slides for Non-deterministic Heater Response.
|
| Attachment 1: Group_Meeting_10_2.pdf
|

|
|
458
|
Tue Oct 15 15:27:38 2024 |
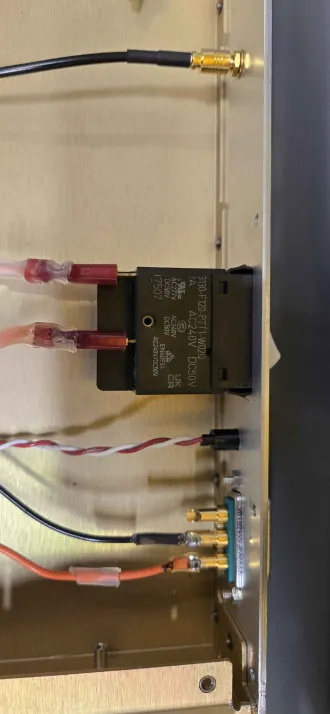
Xuesi Ma | Update | ELOG | Timing Chassis Update |
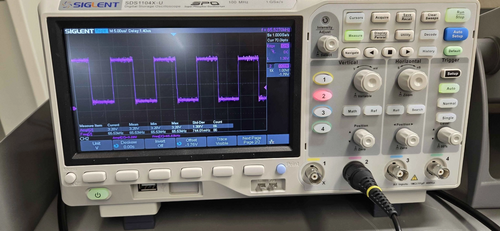
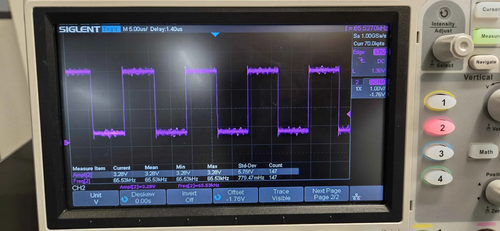
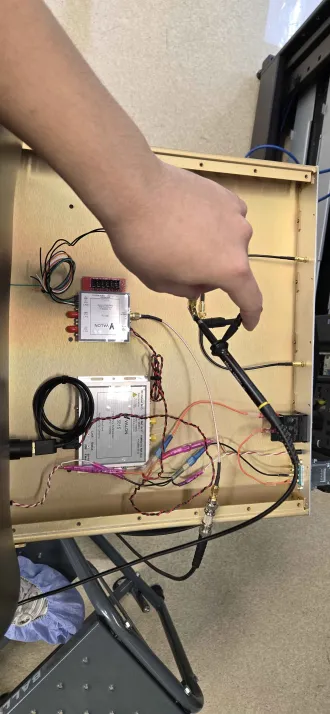
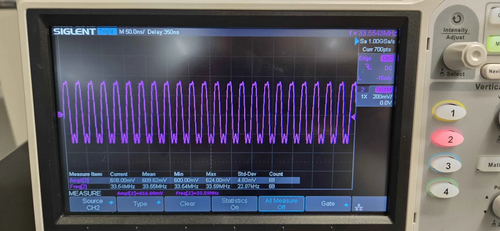
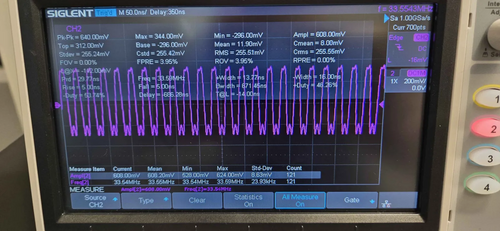
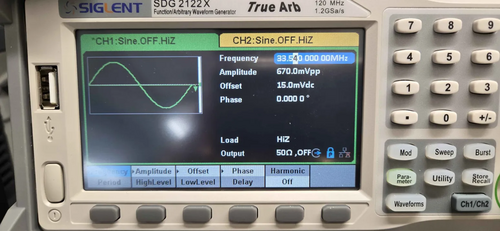
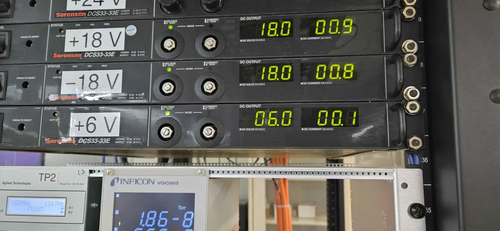
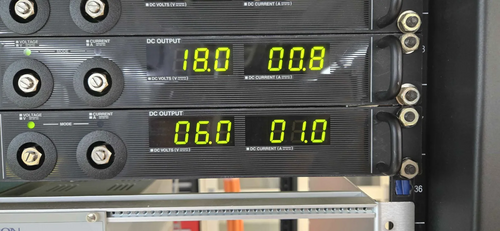
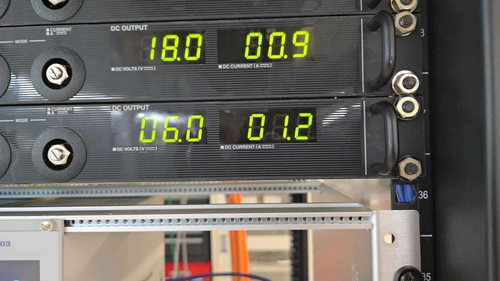
I conducted separate tests on the '5015' and '3010a'. When powered individually, the '5015' outputs a signal at 33.55 MHz with an amplitude of 608 mV. It draws 1 A of current from the power source. The input signal for the '3010a' is 33.54 MHz with an amplitude of 670 mV (peak-to-peak) and a 15 mV DC offset. The output signal from channel 1 is a 65.5 kHz square wave with an amplitude of 3.28 V. The '3010a' draws 0.1 A of current.
Both the '5015' and '3010a' work fine when powered separately. However, when both are powered together, the power source behaves as if there is a short circuit. The current theory is that the switch or breaker is tripping, as it has a 1 A current rating. Since the combined current demand of both devices exceeds 1 A, this may be causing the issue.
Slides for 10/16/2024 Group Meeting |
| Attachment 1: 20241015_134152.mp4
|
| Attachment 2: 20241015_133118.png
|
|
| Attachment 3: 20241015_133124.png
|
|
| Attachment 4: 20241015_133136.png
|
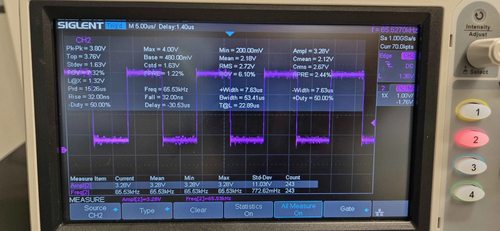
|
| Attachment 5: 20241015_133207.png
|
|
| Attachment 6: 20241015_133543.png
|
|
| Attachment 7: 20241015_133550.png
|
|
| Attachment 8: 20241015_133555.png
|
|
| Attachment 9: 20241015_133300.png
|
|
| Attachment 10: 20241015_133643.png
|
|
| Attachment 11: 20241015_134202.png
|
|
| Attachment 12: 20241015_135353.png
|
|
|
503
|
Mon Jan 27 11:29:38 2025 |
Xuesi Ma | Update | | Heater Element Test |
[Ma, Cece, Luke, Mary, Shane]
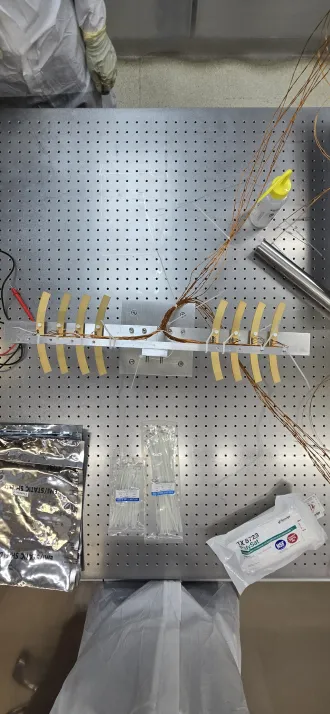
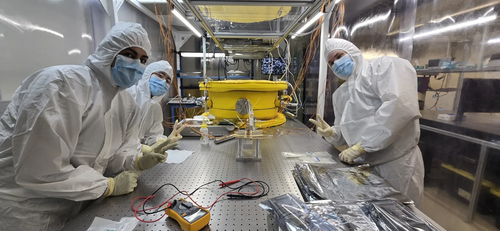
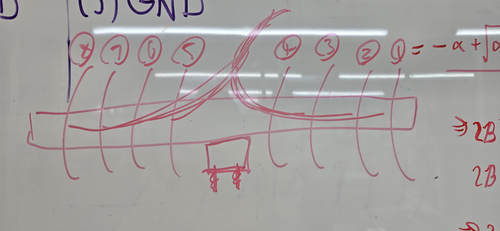
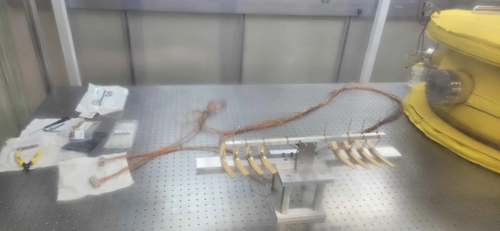
On Friday (Jan 24), we installed the heater elements on the stand. The heater elements are arranged from 1 to 8, oriented from right to left as shown in Attachment 1. Each wire has been labeled according to its corresponding element number and type (e.g., RTD connections, heater connections).
Note: We currently do not have enough PEEK zip ties, so standard zip ties have been used temporarily. These must be replaced with PEEK zip ties before the setup is placed in the vacuum chamber. |
| Attachment 1: 20250124_165434.png
|
|
| Attachment 2: 20250124_165342.png
|
|
| Attachment 3: 20250214_132811.jpg
|
|
|
504
|
Mon Jan 27 23:35:28 2025 |
Xuesi Ma | Update | | |
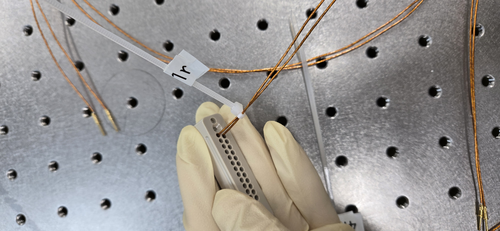
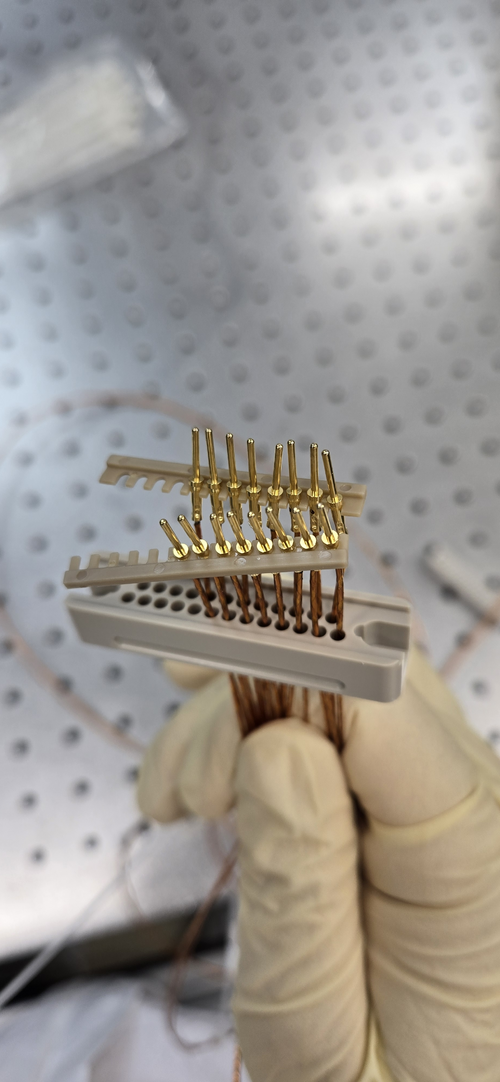
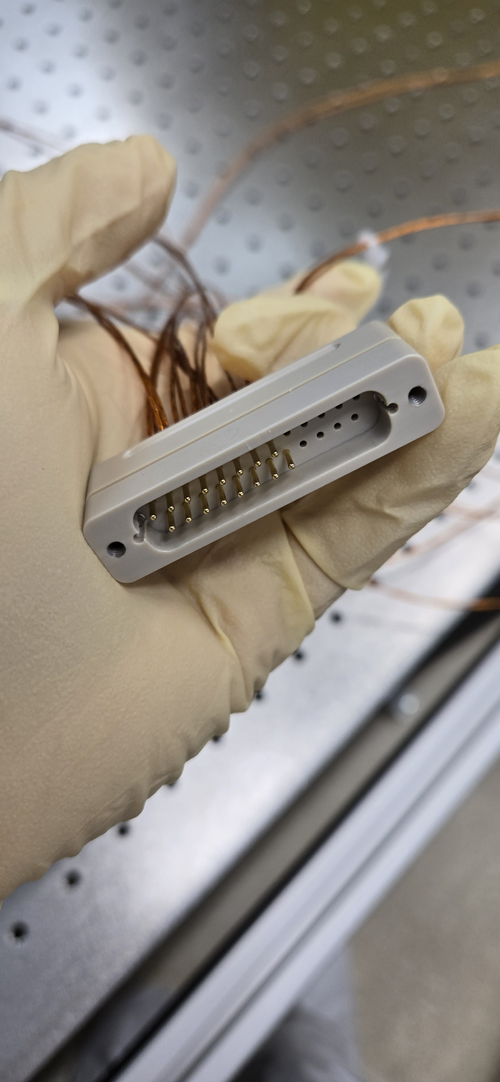
[Ma]
Installed all the pins to the peek DB 25 connectors |
| Attachment 1: 20250127_142647.jpg
|
|
| Attachment 2: 20250127_153454.jpg
|
|
| Attachment 3: 20250127_154516.jpg
|
|
|
506
|
Fri Jan 31 15:03:09 2025 |
Xuesi Ma | Update | | Heater Element Circuit Check |
|
[Ma] Wed 1/29/2025
No short circuit between heater element ✓
No short circuit to ground on any pin ✓
No short circuit between connectors ✓
| Heater Number |
Power Resistor before (Ohm) |
Power Resistor now (Ohm) |
RTD Resistor before (Ohm) |
RTD Resistor now (Ohm) |
| 1 |
73.6 |
73.1 |
81.8 |
81.3 |
| 2 |
70.4 |
69.6 |
82.1 |
81.6 |
| 3 |
71 |
70.5 |
84.5 |
84 |
| 4 |
71.5 |
71 |
80 |
79.4 |
| 5 |
70.5 |
70.2 |
81.7 |
81.2 |
| 6 |
72 |
71.6 |
79.4 |
78.7 |
| 7 |
69.2 |
69 |
78.2 |
77.5 |
| 8 |
71.1 |
70.6 |
84.2 |
83.6 |
|
|
508
|
Mon Feb 3 13:17:21 2025 |
Xuesi Ma | Update | | |
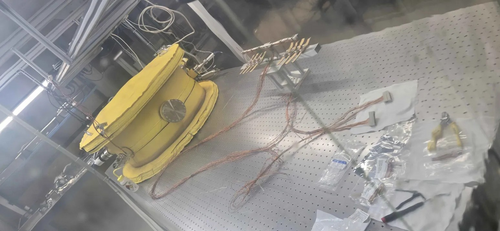
[Ma]
changed all zip ties to peek zip ties, and grouped wires together. The setup is ready to go into the chamber. |
| Attachment 1: 20250203_123153.jpg
|
|
| Attachment 2: 20250203_123213.jpg
|
|
|
514
|
Tue Feb 18 10:01:07 2025 |
Xuesi Ma | Update | | |
[Ma, Pooyan, Tyler]
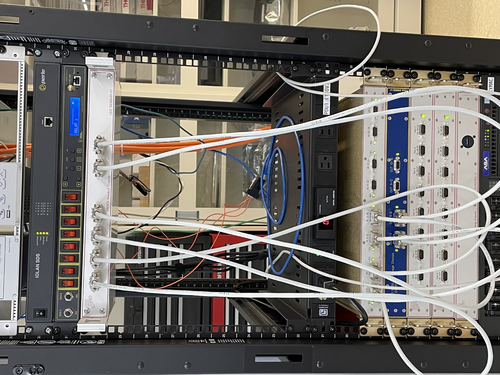
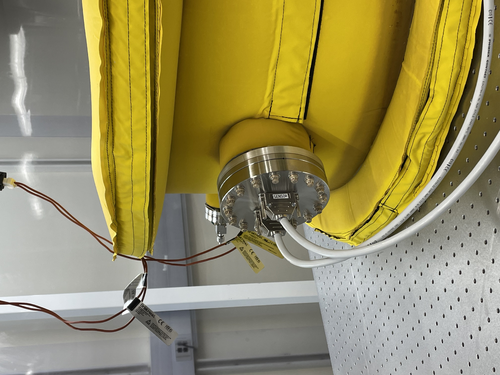
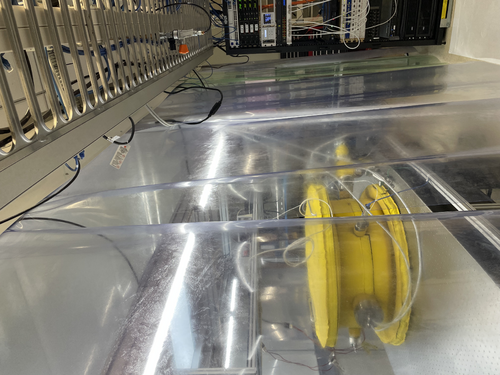
On Friday, we connected the vacuum chamber with the Cymac. |
| Attachment 1: IMG_7916.jpeg
|
|
| Attachment 2: IMG_7915.jpeg
|
|
| Attachment 3: IMG_7917.jpeg
|
|
|
515
|
Tue Feb 18 10:02:16 2025 |
Xuesi Ma | Update | | Group Meeting Slides 2/18/2025 |
https://docs.google.com/presentation/d/1WiV2VqS0BzXNCK6VYYQ-Ty8xlHnzXatQaFbMf1-0rsY/edit?usp=sharing |
|
525
|
Tue Feb 25 10:02:32 2025 |
Xuesi Ma | Update | | |
1424039912.625576 2025/02/19 22:38:14 UTC Time start
24V 2.8A right after start all 8 elements
1424044804.902443 2025/02/19 23:59:46 UTC Time stop
24V 1.8A right before stop all 8 elements
0.1A right before start and right after stop
note: turned on briefly to check current right before stop
2/20 RGA Scan
spikes??
1424129207.857777 2025/02/20 23:26:29 UTC Time start
24V 2.9A right after start all 8 elements
1424140789.856096 2025/02/21 02:39:31 UTC Time stop
24V 1.7A right before stop all 8 elements
0.1A right before start and right after stop
2025/02/21 02:43:19 UTC
Main chamber pressure: 1.54e-8
RGA chamber pressure:5.06e-9
spikes are due to loose connection between connectors.
1424210410.173863 2025/02/21 21:59:52 UTC Time start
24V 2.9A right after start all 8 elements
1424218357.96404 2025/02/22 00:12:19 UTC Time stop
24V 1.7A right before stop all 8 elements
each elements: 0.3A (0.2A increment)(all)
0.1A right before start and right before stop
2/24 RGA Scan
1424467918.129082 2025/02/24 21:31:40 UTC Time start
12V 2A right after start all 8 elements
1424478936.635821 2025/02/25 00:35:18 UTC Time stop
12V 1.6A right before stop all 8 elements
each elements: 0.4A (0.2A increment)(all)
0.2A right before start
rise time: A(1-exp(-t/tau))+B
fall time: Aexp(-t/tau) +B |
| Attachment 1: resistance_vs_time_all_channels_all_time.pdf
|

|
| Attachment 2: temperature_vs_time_all_channels_all_time.pdf
|

|
| Attachment 3: resistance_vs_time_rise_time.pdf
|

|
| Attachment 4: resistance_vs_time_fall_time.pdf
|

|
|
528
|
Tue Mar 4 03:05:42 2025 |
Xuesi Ma | Update | ELOG | LOG |
1424564097.243212 2025/02/26 00:14:39 UTC Time start
12V 2A right after start all 8 elements
1424564478.079428 2025/02/26 00:21:00 UTC Time stop
12V 1.8A right before stop all 8 elements
1424564832.211584 2025/02/26 00:26:54 UTC Time start
12V 1.9A right after start all 8 elements
1424565208.359935 2025/02/26 00:33:10 UTC Time stop
12V 1.8A right before stop all 8 elements
1424565573.565066 2025/02/26 00:39:15 UTC Time start
12V 1.8A right after start all 8 elements
1424565931.242394 2025/02/26 00:45:13 UTC Time stop
12V 1.7A right before stop all 8 elements
1424566292.67104 2025/02/26 00:51:14 UTC Time start
12V 1.8A right after start all 8 elements
1424566648.619952 2025/02/26 00:57:10 UTC Time stop
12V 1.7A right before stop all 8 elements
1424566996.312246 2025/02/26 01:02:58 UTC Time start
12V 1.8A right after start all 8 elements
1424567381.748943 2025/02/26 01:09:23 UTC Time stop
12V 1.7A right before stop all 8 elements
1424567756.528736 2025/02/26 01:15:38 UTC Time start
12V 1.7A right after start all 8 elements
0.2A right before start
spikes!?
1424643001.864687 2025/02/26 22:09:43 UTC
change c_0(VEXC0 & VCXC0) to 2V (why is it on 5V ?)
2025/02/26 22:18:51 UTC
Main chamber pressure:5.92e-9
RGA chamber pressure:1.98e-9
1424650528.240947 2025/02/27 00:15:10 UTC Time start (increase voltage)
24V 2.1A right after start all 8 elements
disconnect and reconnect (exc 1-4)(out 9-12) & (exc 5-8)(out 13-16)
2025/02/27 19:34:26 UTC
Main chamber pressure:1.34e-8
RGA chamber pressure:4.33e-9
Main chamber temp: 29
RGA chamber temp:29
2025/02/28 18:02:29 UTC
Main chamber pressure:1.05e-8
RGA chamber pressure:3.53e-9
Main chamber temp: 29
RGA chamber temp:30
1424801097.374902 2025/02/28 18:04:39 UTC Time stop
24V 1.8A right before stop all 8 elements
0.1A right after stop
1424827460.71372 2025/03/01 01:24:02 UTC Time start
24V 2.9A right after start all 8 elements
0.1A right before start
2025/03/01 01:25:34 UTC
Main chamber pressure:5.98e-9
RGA chamber pressure:2.06e-9
Main chamber temp:27
RGA chamber temp:27
2025/03/03 20:28:03 UTC
Main chamber pressure:7.8e-9
RGA chamber pressure:2.64e-9
Main chamber temp:27
RGA chamber temp:27 |
|
529
|
Tue Mar 4 03:33:18 2025 |
Xuesi Ma | Update | | Update |
Spikes Appear Again, need to address it systematically.
Power on and off before reaching steady state ✔
At 12V, the rise and fall time of heater elements are different from 24V.
Initial guess is due to temperature in the chamber. However, it does not seem to be the case, 24V with 30c have the same hall time as 24V at lower temperature.
Attached are some graphs for rise and fall time
After a weekend of powering on, the main chamber pressure stabilized in the UHV region.
Temperature in the chamber seems also not to change. |
| Attachment 1: resistance_vs_time_all_channels_all_time.pdf
|

|
| Attachment 2: resistance_vs_time_rise_time.pdf
|

|
| Attachment 3: resistance_vs_time_fall_time.pdf
|

|
| Attachment 4: resistance_vs_time_rise_time_12V.pdf
|

|
| Attachment 5: resistance_vs_time_fall_time_12V.pdf
|

|
| Attachment 6: resistance_vs_time_fall_time_24V_30c.pdf
|

|
|
539
|
Tue Mar 11 10:43:57 2025 |
Xuesi Ma | Update | | |
Continue investigation in the spikes
Pulsed ADC with a function generator and find no spikes. Rules out ADC for causing the spikes
Loopback test that bypasses the FROSTI Chassis shows spikes (spikes happened on all channels at the same time)
Next step is to bypass the AI Chassis to find the source of the spikes |
| Attachment 1: 20250310_171936.jpg
|
|
|
544
|
Mon Mar 31 15:41:56 2025 |
Xuesi Ma | Update | | |
The result from AI Chassis bypass test showed that the AI Chassis may be the problem. There are no spikes from DAC's direct output.
All chassis except timing chassis are turned off. Power supplies for 24V, 18V, and -18V are turned off
The AI chassis has been taken out of the rack for further inspection
Refer to:
https://dcc.ligo.org/LIGO-E2300117
https://dcc.ligo.org/cgi-bin/private/DocDB/ShowDocument?.submit=Identifier&docid=D2300124&version= |
|
547
|
Mon Apr 7 13:28:49 2025 |
Xuesi Ma | Update | | |
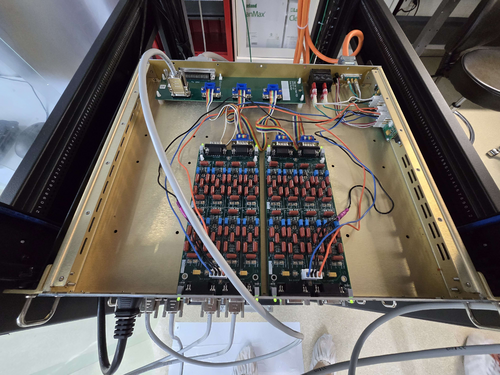
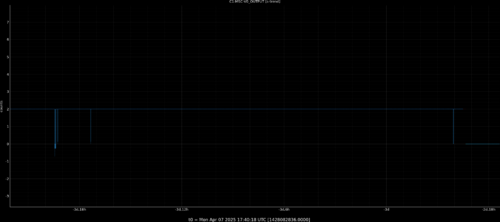
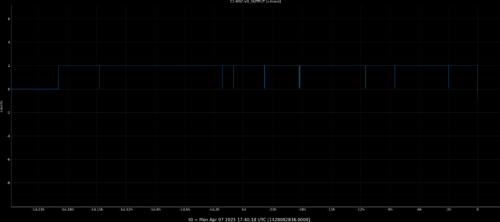
Test 1: Adapter Board Connected to Filter Board
- Setup: AI Chassis is powered on. Signal is measured directly from the adapter board. All other ports on the adapter board are connected to the filter board.
- Observation: Two distinct spikes observed at the beginning of the measurement.
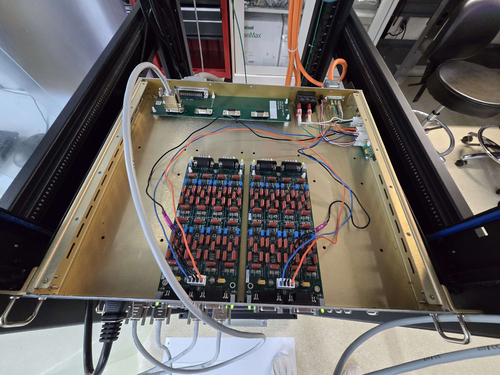
Test 2: Adapter Board Disconnected from Filter Board
- Setup: AI Chassis remains powered on. Signal is again measured directly from the adapter board. This time, the remaining ports on the adapter board are not connected to the filter board.
- Observation: Multiple spikes observed, distributed evenly across the entire measurement.
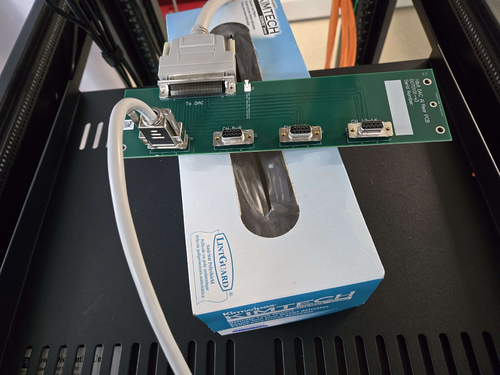
Test 3: Isolation Test with Spare Adapter Board (ongoing)
- Setup: Suspecting the original adapter board may be faulty, a spare adapter board is used for comparison. Signal is measured directly from this spare board.
-
Update, 04/08/25, Tue 17:30
Took the old adapter board out of the AI chassis and and used it to connect DAC to AA chassis. If no spikes are seen, it means that the glitches are not originating from this board.
Also checked al the previous spikes using the raw data (65536 Hz sample rate). The duration of the glitches are ~1 second, despite the previous guess that they are happening in the Milli-second scale.
|
| Attachment 1: 20250403_151946.jpg
|
|
| Attachment 2: ELOG_Spike_adapter_filter_on.png
|
|
| Attachment 3: 20250404_143624.jpg
|
|
| Attachment 4: ELOG_Spike_adapter_isolate.png
|
|
| Attachment 5: 20250407_105846.jpg
|
|
|
553
|
Tue Apr 15 11:13:43 2025 |
Xuesi Ma | Update | | |
Test 4: AI Chassis ground isolation
- Setup: AI Chassis isolated from the ground with readout directly connected to adapter board
- Observation: No spike observed.
Test 5: Ribbon cable check
- Setup: AI Chassis remains isolated from the ground. The signal is measured after the ribbon cable. (Attachment 3)
- Observation: No spike observed.
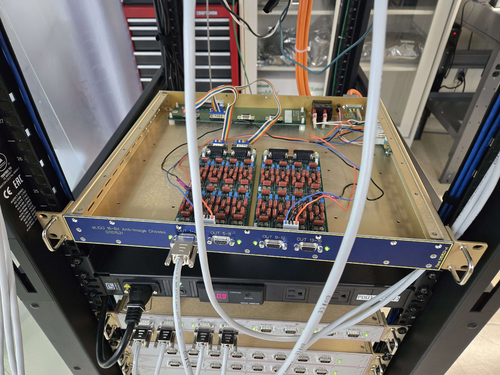
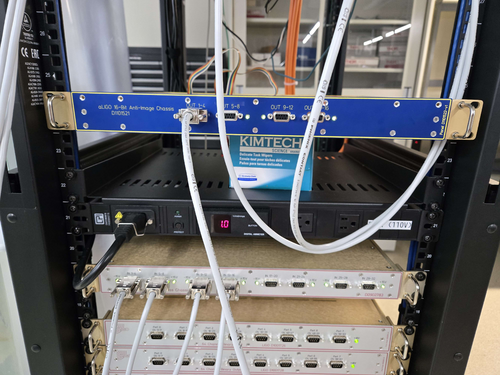
Test 6: Single ground connection check
- Setup: AI chassis powered on but remains isolated from the frame. The signal is measured from the output of the AI Chassis. (Attachment 1 ,2)
-
- Observation: No spike observed.
|
| Attachment 1: 20250414_120428.jpg
|
|
| Attachment 2: 20250414_120423.jpg
|
|
| Attachment 3: 20250411_163105.jpg
|
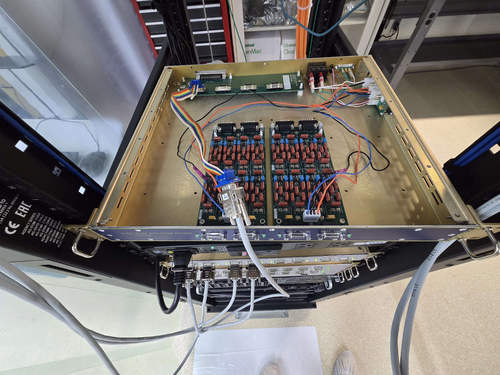
|
|
559
|
Tue Apr 22 12:08:46 2025 |
Xuesi Ma | Update | | |
Test 7: Reconnect ribbon cables
- Setup: Reconnect all the ribbon cables, and turned on the AI Chassis while isolated rack
- Observation: No spike observed.
Test 8: Reconnect to rack
- Setup: Reconnect the AI Chassis to the rack.
- Observation: No spike observed.
Test 9: Restore to original position.
- Setup: CLose up the AI Chassis, and put it back to its original location.
-
- Observation: No spike observed.
|
| Attachment 1: 20250415_161755.jpg
|
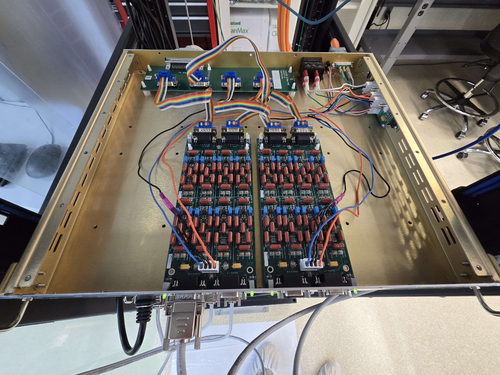
|
| Attachment 2: 20250416_174640.jpg
|
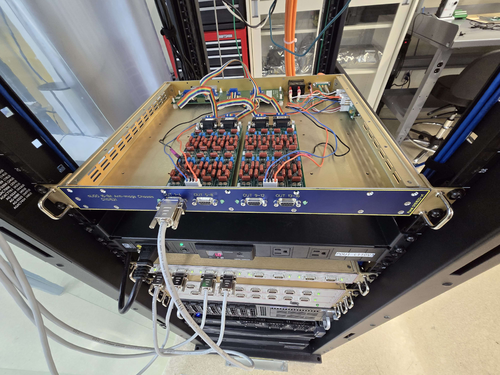
|
| Attachment 3: 20250422_105614.jpg
|
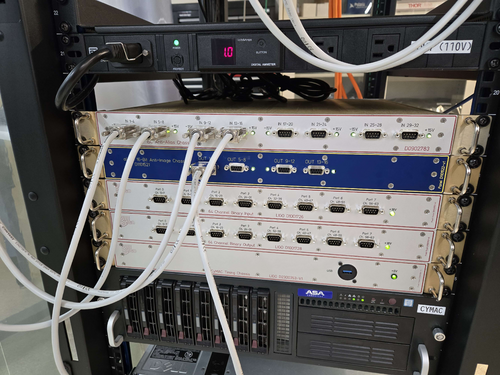
|
|
567
|
Wed Apr 30 17:33:14 2025 |
Xuesi Ma | Update | VAC | Started bake |
[Luke, Ma, Tyler]
The vacuum chamber is currently baking.
Current state as of 5:00
The gate valve is open, and the filament of the RGA is on. Argon leak is opened
The temperatures are as follows:
PID right barrel upper: 99°C, RGA volume: 120°C
PID left barrel lower: 123°C, Lid: 92°C |
|
568
|
Fri May 2 12:34:02 2025 |
Xuesi Ma | Update | VAC | Stopped bake |
The vacuum chamber has stopped baking.
Current state as of 12:30, 5/2/2025:
The gate valve is open, and the filament of the RGA is on.
The temperatures were steady at:
PID right: barrel upper: 108°C, RGA volume: 120°C
PID left: barrel lower: 120°C, Lid: 91°C |
|
572
|
Tue May 6 13:19:31 2025 |
Xuesi Ma | Update | | |
|
| Attachment 1: resistance_vs_time_RV_rise_time_24.pdf
|

|
| Attachment 2: resistance_vs_time_all_channels_all_time_RV.pdf
|

|
|
576
|
Tue May 13 12:35:01 2025 |
Xuesi Ma | Update | | |
|
| Attachment 1: resistance_vs_voltage_all.pdf
|

|
| Attachment 2: resistance_vs_voltage_overlay.pdf
|

|
| Attachment 3: resistance_vs_time_all_channels_all_time_RV.pdf
|

|
|
578
|
Thu May 15 12:03:41 2025 |
Xuesi Ma | Infrastructure | Electronics | Notice |
All Sorensen power supplies are turned off. The Cymac system is down (All Chassis are down)
If you need more information or if you need to turn them back on please contact Xuesi Ma. |
|
579
|
Mon May 19 10:59:14 2025 |
Xuesi Ma | Infrastructure | | |
Status Update
Previous Status:
All Sorensen power supplies were turned off. The Cymac system was down (all chassis were offline).
If you need more information or assistance in turning them back on, please contact Xuesi Ma.
Update: The systems are now back online.
Note: The Sorensen power supplies’ voltage can now be controlled via channel VEXC8 of the DAC.
If scripting is required, the ezca Python package is highly recommended for interfacing and control.
|
|
580
|
Wed May 21 14:40:38 2025 |
Xuesi Ma | Infrastructure | Cleanroom | Cleanroom Temperature |
|
Date and Time: Around 2:20 PM on May 21, 2025
Location and Temperature:
- Back of the room, around the working station: 85.5 °F
- Front of the room, around the doorway: 82.3 °F
|