| ID |
Date |
Author |
Type |
Category |
Subject |
|
520
|
Sun Feb 23 12:11:43 2025 |
Luke | Summary | Cleanroom | Cleanroom cleaning |
[Luke, Mary, Luis]
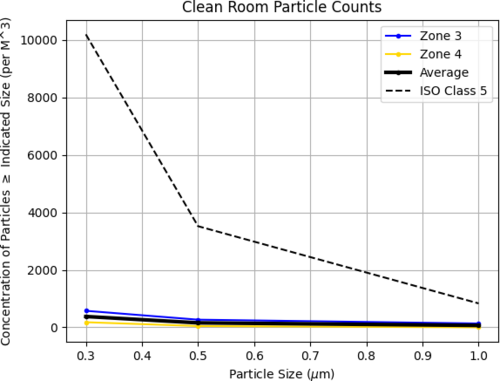
Particle Count Measurements:
- Pre-cleaning (8:40 am):
- Zone 3:
- 0.3 µm: 441
- 0.5 µm: 44
- 1.0 µm: 0
- Zone 4:
- 0.3 µm: 353
- 0.5 µm: 176
- 1.0 µm: 44
- Started Cleaning (3:16 pm)
- Finished Cleaning (4:10 pm)
- Post-cleaning (4:15 pm):
- Zone 3:
- 0.3 µm: 574
- 0.5 µm: 265
- 1.0 µm: 132
- Zone 4:
- 0.3 µm: 177
- 0.5 µm: 44
- 1.0 µm: 0
|
| Attachment 1: partical_count_2-21-25.png
|
|
|
519
|
Thu Feb 20 17:07:36 2025 |
Luis | Update | VAC | RGA Scan |
| [Ma, Luis]
February 20, 2025 - 3:30 PM
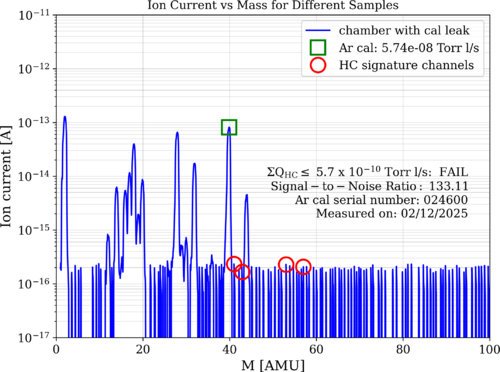
Ma performed an RGA scan with the vacuum system containing the heater elements. The results are attached below.
|
Pressure (Torr) |
Temperature (°C) |
| RGA Volume |
1.87× 10⁻⁹ |
23 |
| Main Volume |
5.70 × 10⁻⁹ |
23 |
As we can see, we are not yet under cleanliness standards. The passing threshold is 4 × 10⁻¹⁰, we are very close to it.
|
| Attachment 1: 2025-2-20_HeaterElement_ArO.png
|
|
|
518
|
Wed Feb 19 13:44:48 2025 |
Shane | Update | CDS | Vac serial interfacing update |
|
[Jon, Shane]
Debugging update for vac system serial communications: we were able to successfully connect the smaller turbo pump to the Varian (manufacturer) software today by plugging the controller db9 directly into spica, and verified that the pump was able to send and receive information. Still no success on communication with the larger pump via python serial code, though. Issue potentially lies in the pinout mapping of the connectors, as the pinouts we'd been using work successfully for the small pump which only requires 3 connections (RXD, TXD, GND), but the large pump may require more. Tried to test this on the big pump by keeping the pinout setup for the small pump, and incrementally adding the remaining 6 connections on a one to one scale (Pin 1 matched to Pin 1, etc) between the controller DB9 and the field DB9 connected to the IOLAN ethernet cable. After each new connection was added, I retried running the serial connection code. None of the additional connections yielded any results, and the large pump remained unable to connect through the code. Next step is further looking into documentation on the pinouts to see if the large pump requires a different connection setup than the small pump.
|
|
517
|
Tue Feb 18 11:19:13 2025 |
Luke | Configuration | VAC | Repositioning of the lid's temperature probe |
| Before the recent bake I slightly repositioned the temperature probe on the lid from beside the heater tape to under the heater tape. This was done to better know and control the temperatures of the chamber while baking. It has appeared to work with the temperatures being held very close to the 120C target. |
|
516
|
Tue Feb 18 10:12:39 2025 |
Tyler | Update | TCS | Final RIN Plot Update |
Below is a preview of the final RIN figure that will be included in the FROSTI instrument paper. A quick summary of what is shown below:
The original RIN CSD measurement is shown on the top panel in red. Frequency bins that exhibit external electronics noise (ex. ADC, photodetector noise, etc.) are identified and shaded in gray. These noisy bins are then excluded from the dataset before beginning the next step in the analysis process: rebinning. Here, the resolution of the spectrum can be changed by averaging frequency bins together within a specified interval, with the goal of pushing the measurement curve closer to the A+ requirement shown in the figure. For demonstration below, the spectrum goes from a resolution of ~0.93 Hz to 14.90 Hz.
|
| Attachment 1: Preliminary_RIN_plot.pdf
|

|
| Attachment 2: FROSTI_ON.pdf
|

|
| Attachment 3: Dark_Noise.pdf
|

|
| Attachment 4: ADC_Noise.pdf
|

|
|
515
|
Tue Feb 18 10:02:16 2025 |
Xuesi Ma | Update | | Group Meeting Slides 2/18/2025 |
https://docs.google.com/presentation/d/1WiV2VqS0BzXNCK6VYYQ-Ty8xlHnzXatQaFbMf1-0rsY/edit?usp=sharing |
|
514
|
Tue Feb 18 10:01:07 2025 |
Xuesi Ma | Update | | |
[Ma, Pooyan, Tyler]
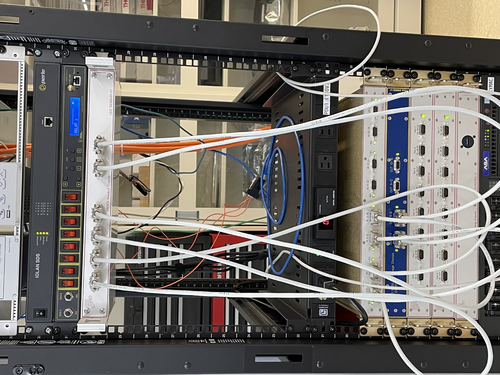
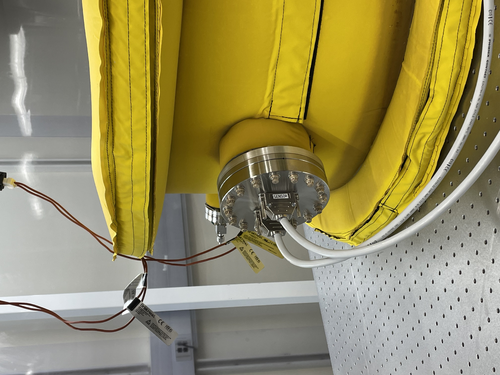
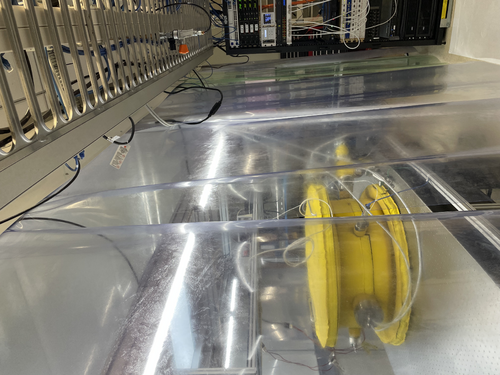
On Friday, we connected the vacuum chamber with the Cymac. |
| Attachment 1: IMG_7916.jpeg
|
|
| Attachment 2: IMG_7915.jpeg
|
|
| Attachment 3: IMG_7917.jpeg
|
|
|
513
|
Sun Feb 16 16:45:18 2025 |
Luke | Update | General | Ringheater position optimization |
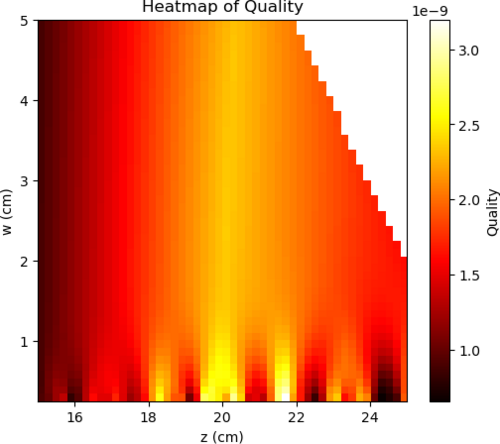
Over the last couple weeks I have been working on finding the optimal position of the ringheater's thermal profile.
Today I would like to give an update of where I am at and my next steps.
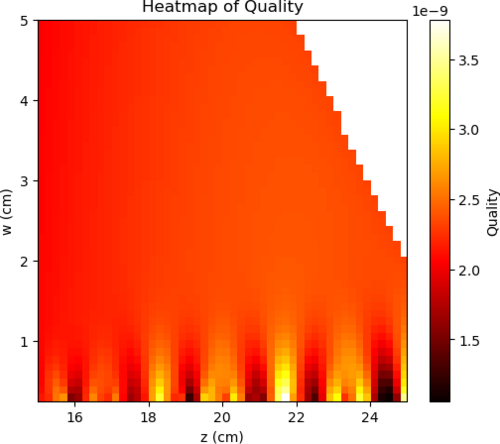
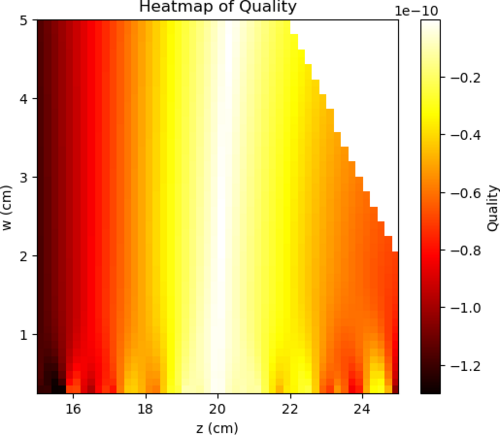
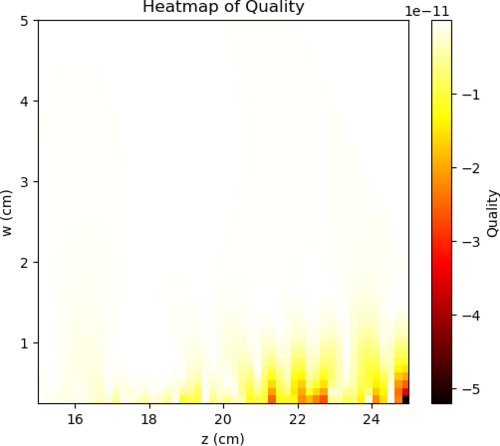
Using the python COMSOL interface I have been able to run and save deformation data sweeping through a great deal of potential combinations of widths and positions.
I then calculated their zernike coefficients and using a very simple "quality" function (02 - (40)*10 - (4-4)*10), where 02 stands for the zernike mode of quadratic deformation, I was able to generate a heat map of comparing the "quality" verses the width and position used.
Seen below are four plots. The first is simply the 02 coefficient of the decomposition followed by the negative of 40 and 4-4 then the "quality."
This 'quality' function was an arbitrary choice on my part. I believe that my next step would either be defining a more useful function or using finesse to model the actual effects of this surface deformation. |
| Attachment 1: 02.png
|
|
| Attachment 2: _40.png
|
|
| Attachment 3: _4-4.png
|
|
| Attachment 4: 02_40_4-4.png
|
|
|
512
|
Fri Feb 14 12:15:23 2025 |
Luis | Update | VAC | Vacuum sytem staus |
|
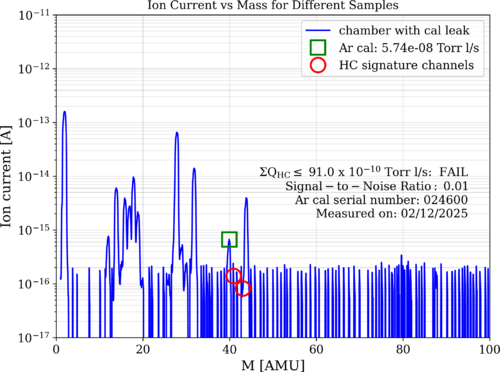
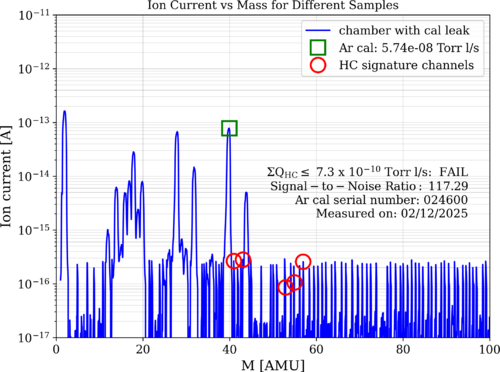
[Luis, Luke, Ma]
February 12, 2025 - 4:00 PM
We performed an RGA scan with the vacuum system containing the heater elements. The results are attached below.
|
Pressure (Torr) |
Temperature (°C) |
| RGA Volume |
3.13 × 10⁻⁹ |
23 |
| Main Volume |
6.15 × 10⁻⁹ |
23 |
As we can see, we are not yet under cleanliness standards. The passing threshold is 4 × 10⁻¹⁰, and we are currently measuring nearly double this value. We will continue performing scans to monitor any changes in these readings.
|
| Attachment 1: 2025-2-12_HeaterElement-Bake1_ArC.png
|
|
| Attachment 2: 2025-2-12_HeaterElement-Bake1_ArO.png
|
|
|
511
|
Fri Feb 14 11:57:50 2025 |
Luis | Update | VAC | Vacuum Update |
[Luis]
Feb/11/25 9:30am
Pressure gages were connected.
|
|
510
|
Tue Feb 11 08:07:02 2025 |
Luis | Update | VAC | Bake stopped |
[Luis, Ma]
Feb/10/25 4:00pm
Bake was stopped.
|
|
509
|
Fri Feb 7 12:25:56 2025 |
Luke | Summary | VAC | Started bake |
[Luke, Luis]
The vacuum chamber is currently baking.
We stepped up to 120°C by increments of 30°C starting at 60°C. We took about an hour break at 90°C to let the temperatures equilibrate.
Current state as of 12:20:
The gate valve is open, the calibrated Argon leak is open, and the filament of the RGA is on.
The temperatures are as follows:
PID right barrel upper: 113°C, RGA volume: 120°C
PID left barrel lower: 121°C, Lid: 114°C
The lower temperatures should climb as the whole system heats up.
|
|
508
|
Mon Feb 3 13:17:21 2025 |
Xuesi Ma | Update | | |
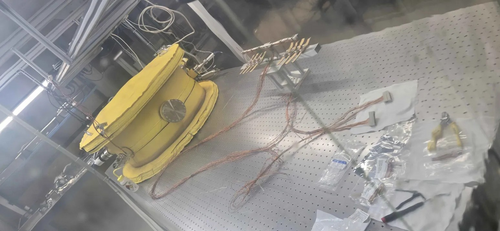
[Ma]
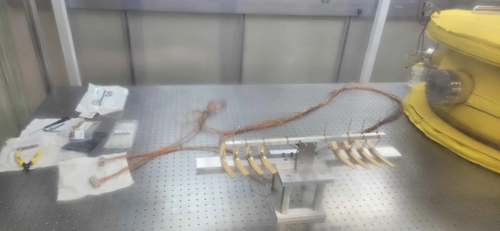
changed all zip ties to peek zip ties, and grouped wires together. The setup is ready to go into the chamber. |
| Attachment 1: 20250203_123153.jpg
|
|
| Attachment 2: 20250203_123213.jpg
|
|
|
507
|
Sat Feb 1 17:25:52 2025 |
Luke | Summary | General | Cleanroom cleaning |
[Luke, Cece, Luis]
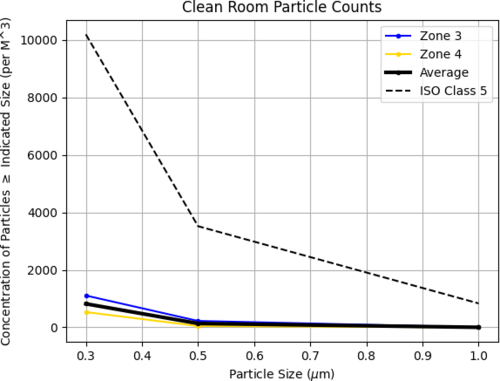
Particle Count Measurements:
- Pre-cleaning (12:15 PM):
- Zone 3:
- 0.3 µm: 1325
- 0.5 µm: 265
- 1.0 µm: 0
- Zone 4:
- 0.3 µm: 618
- 0.5 µm: 132
- 1.0 µm: 44
- Started Cleaning (3:20 pm)
- Finished Cleaning (4:20 pm)
- Post-cleaning (4:35 PM):
- Zone 3:
- 0.3 µm: 1106
- 0.5 µm: 221
- 1.0 µm: 0
- Zone 4:
- 0.3 µm: 530
- 0.5 µm: 44
- 1.0 µm: 0
|
| Attachment 1: 20250131_particalcount.png
|
|
|
506
|
Fri Jan 31 15:03:09 2025 |
Xuesi Ma | Update | | Heater Element Circuit Check |
|
[Ma] Wed 1/29/2025
No short circuit between heater element ✓
No short circuit to ground on any pin ✓
No short circuit between connectors ✓
| Heater Number |
Power Resistor before (Ohm) |
Power Resistor now (Ohm) |
RTD Resistor before (Ohm) |
RTD Resistor now (Ohm) |
| 1 |
73.6 |
73.1 |
81.8 |
81.3 |
| 2 |
70.4 |
69.6 |
82.1 |
81.6 |
| 3 |
71 |
70.5 |
84.5 |
84 |
| 4 |
71.5 |
71 |
80 |
79.4 |
| 5 |
70.5 |
70.2 |
81.7 |
81.2 |
| 6 |
72 |
71.6 |
79.4 |
78.7 |
| 7 |
69.2 |
69 |
78.2 |
77.5 |
| 8 |
71.1 |
70.6 |
84.2 |
83.6 |
|
|
505
|
Tue Jan 28 13:30:46 2025 |
shane | Update | CDS | Serial comms testing update |
| Attempted to communicate with the smaller vac pump (TwissTor 74) via Agilent software today. Was able to communicate with the pump via python serial connection code as usual, with no issues. When using the manufacturer software though, it was unable to 'locate' the pump and failed to connect to it. So manufacturer software works for the big (older) pump, but not the smaller, newer one. Unclear if this is somehow related to the fact that using the manufacturer software for the bigger pump involved manually connecting its controller to spica with a db9, and there was no obvious way to do that for the smaller pump's controller. |
|
504
|
Mon Jan 27 23:35:28 2025 |
Xuesi Ma | Update | | |
[Ma]
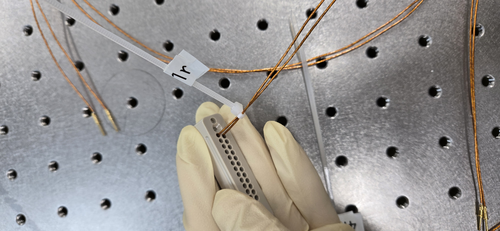
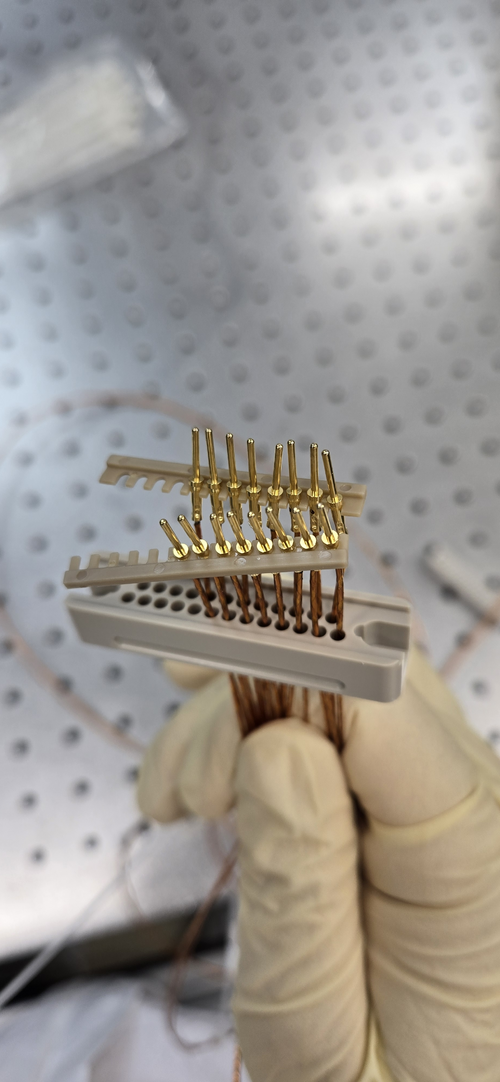
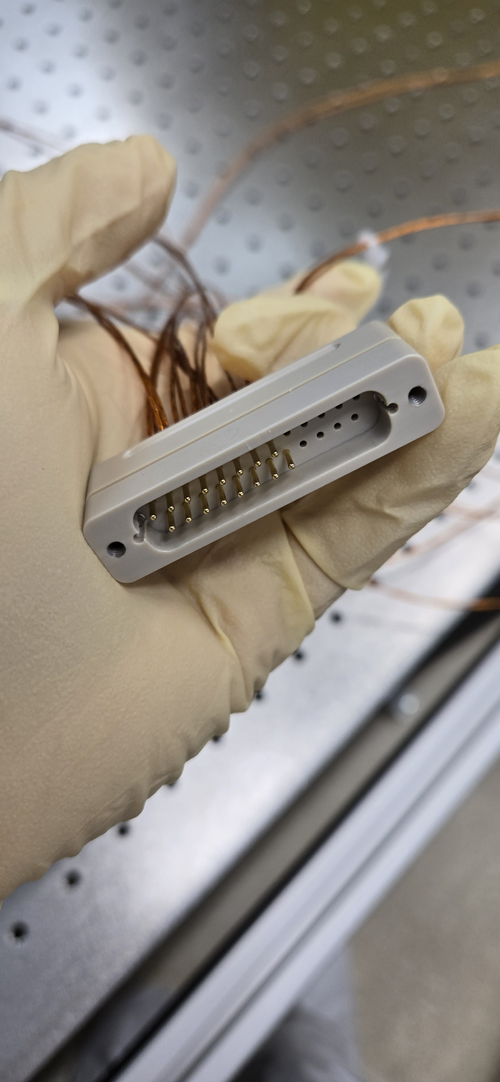
Installed all the pins to the peek DB 25 connectors |
| Attachment 1: 20250127_142647.jpg
|
|
| Attachment 2: 20250127_153454.jpg
|
|
| Attachment 3: 20250127_154516.jpg
|
|
|
503
|
Mon Jan 27 11:29:38 2025 |
Xuesi Ma | Update | | Heater Element Test |
[Ma, Cece, Luke, Mary, Shane]
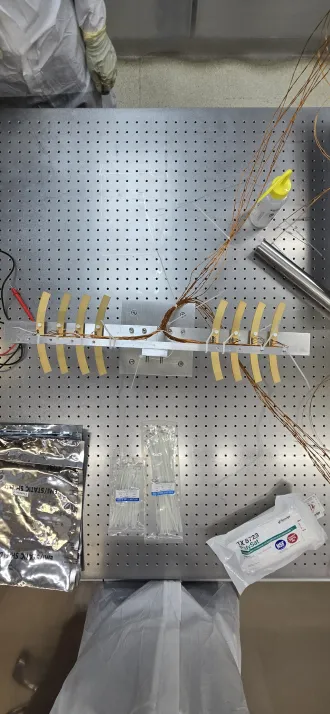
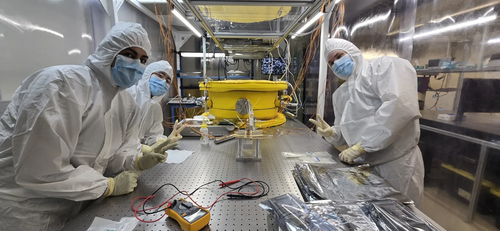
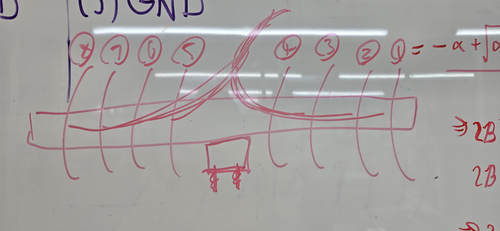
On Friday (Jan 24), we installed the heater elements on the stand. The heater elements are arranged from 1 to 8, oriented from right to left as shown in Attachment 1. Each wire has been labeled according to its corresponding element number and type (e.g., RTD connections, heater connections).
Note: We currently do not have enough PEEK zip ties, so standard zip ties have been used temporarily. These must be replaced with PEEK zip ties before the setup is placed in the vacuum chamber. |
| Attachment 1: 20250124_165434.png
|
|
| Attachment 2: 20250124_165342.png
|
|
| Attachment 3: 20250214_132811.jpg
|
|
|
502
|
Sat Jan 25 18:19:39 2025 |
Luke | Update | General | Ringheater modeling Update |
Here is a quick update on some of the things I have been working on regarding my project. |
|
501
|
Wed Jan 22 10:50:08 2025 |
Tyler | Update | TCS | FROSTI Disassembly |
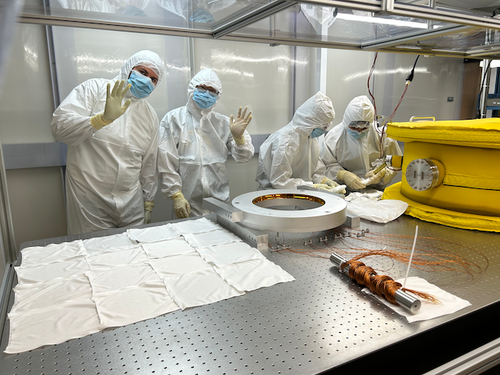
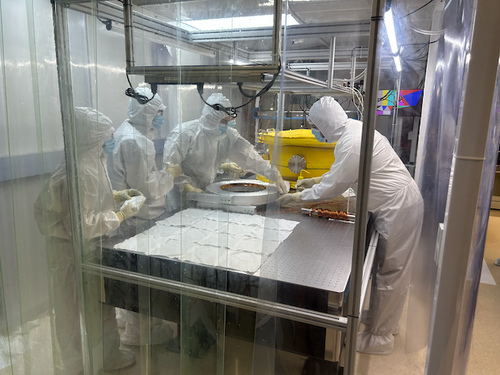
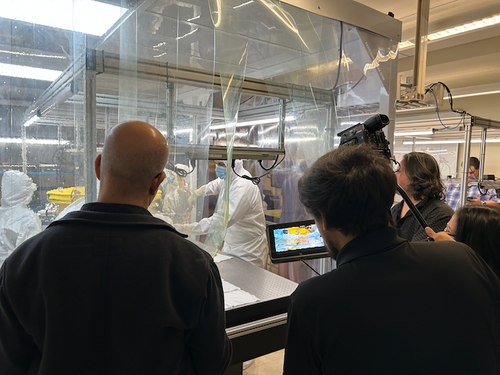
| [Tyler, Ma, Cece, Luis, Shane, Luke, Cynthia, Liu, Jon]
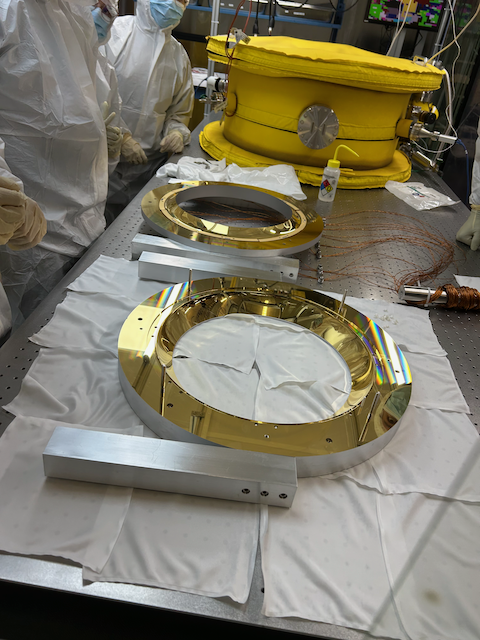
On Tuesday (Jan 21), we took the FROSTI apart in front of a filming crew. It was a success! The footage is going to be used in an APS video detailing the experimental cosmology research conducted in the department.
The FROSTI reflectors, heater elements, and legs were all bagged separately and a currently being stored in the cleanroom. If you need to do any work in there, please be mindful of these parts. The elements are currently on the shelf above the optical table, and the reflectors are placed on the table in the back corner. |
| Attachment 1: IMG_1843.png
|
|
| Attachment 2: IMG_1844.png
|
|
| Attachment 3: IMG_1849.png
|
|
| Attachment 4: IMG_1850.png
|
|
|
500
|
Tue Jan 21 10:12:02 2025 |
Luke | Summary | General | Frosti toy model |
[Luke, Liu]
Over the winter break I have been working on this desmos toy model of the Frosti. There are still a few rough spots but I belive that it is a good visual representation of a 2D slice of the frosti. |
|
499
|
Fri Jan 17 13:27:07 2025 |
Tyler | Update | TCS | FROSTI Pre-disassembly |
| [Tyler, Ma, Cece, Jon, Luke, Cynthia, Michael]
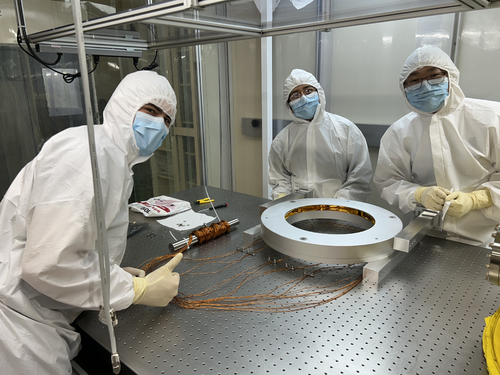
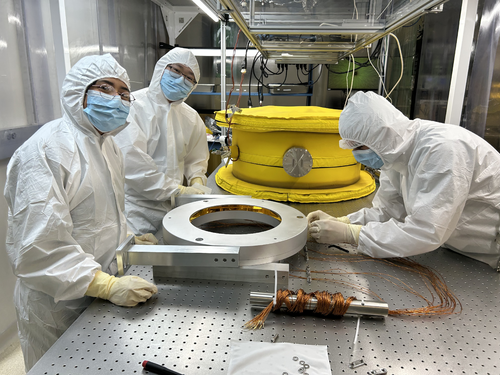
On Tuesday, we prepared the FROSTI for disassembly in anticipation of the APS filming that is set to take place in the labs. The FROSTI has been unbolted from the optical table in the cleanroom, with its wires weighted down and the majority of its screws removed to ensure an easy removal of the reflectors during the filming process.
|
| Attachment 1: IMG_1828.jpeg
|
|
| Attachment 2: IMG_1830.jpeg
|
|
|
498
|
Tue Jan 14 10:27:14 2025 |
Tyler | Update | TCS | RIN Updates |
| [Tyler]
Attached below are updated plots for the FROSTI RIN measurements for Jan 14 group meeting.
|
| Attachment 1: ASD_plots_01_14_2025.pdf
|

|
|
497
|
Wed Jan 8 17:35:57 2025 |
Luke | Summary | Cleanroom | Cleanroom cleaning |
[Luke, Tyler, Cynthia, Shane, Michael]
Summary of Cleaning Activities:
We began cleaning Room 1119 at 2:00 PM.
At 2:30 PM, we moved to Room 1129 and continued cleaning.
Cleaning tasks included wiping down dust-collecting surfaces and vacuuming the floors.
Once the labs were clean, we proceeded to the cleanroom.
- Wiping down surfaces and soft walls
- Vacuuming, mopping the floor, and finishing with IPA wipes
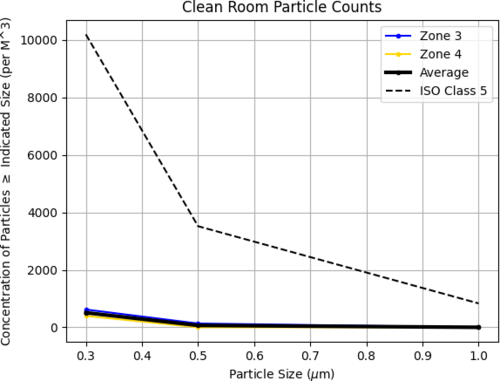
Particle Count Measurements:
- Pre-cleaning (2:30 PM):
- Zone 3:
- 0.3 µm: 973
- 0.5 µm: 354
- 1.0 µm: 132
- Zone 4:
- 0.3 µm: 486
- 0.5 µm: 177
- 1.0 µm: 0
- Post-cleaning (4:10 PM):
- Zone 3:
- 0.3 µm: 619
- 0.5 µm: 132
- 1.0 µm: 0
- Zone 4:
- 0.3 µm: 397
- 0.5 µm: 0
- 1.0 µm: 0
|
| Attachment 1: partical_count_250108.png
|
|
|
496
|
Thu Jan 2 17:52:58 2025 |
Luis | Update | VAC | MR Testing Continuation |
[Luis, Luke]
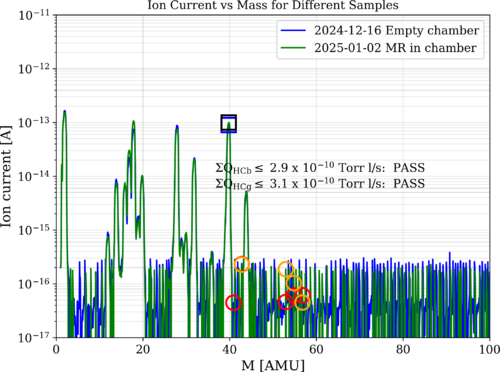
RGA Volume: T = 22°C, P = 2.10e-9 Torr
Main Volume: T = 21°C, P = 5.71e-9 Torr
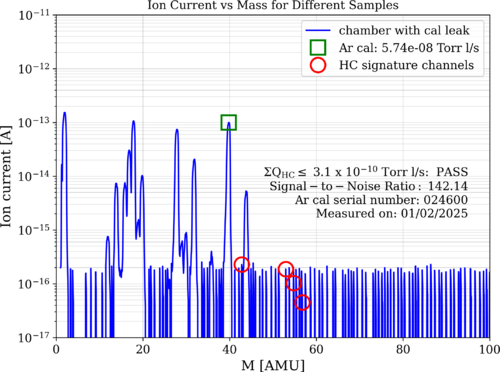
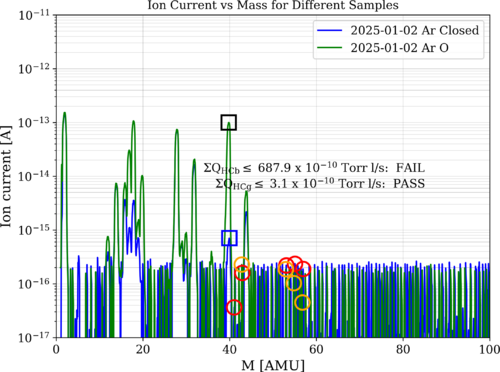
Measurements of the current state of the vacuum systems were taken today, now that the system had reached UHV status, the results are attached bellow. The first plot overlays the data of the empty chamber taken on 12/16/24 before inserting the MR material, and the data of the system today, with the MR inside. The second plot displays the S/N Ratio of the system. The last plot displays the data of the system with the Ar leak open and closed. Notice that it is common for the Ar leak close data to fail due to the calculation of the gas flux per unit ion current, which is dependent on the Ar peak.
|
| Attachment 1: 2024-12-16_PostBake2_ArO_overlay.png
|
|
| Attachment 2: 2025-1-2_MR-Bake1_ArO.png
|
|
| Attachment 3: 2025-1-2_MR-Bake1_ArC_overlay.png
|
|
|
495
|
Mon Dec 23 14:33:36 2024 |
Tyler | Update | TCS | Latest RIN Measurement Results |
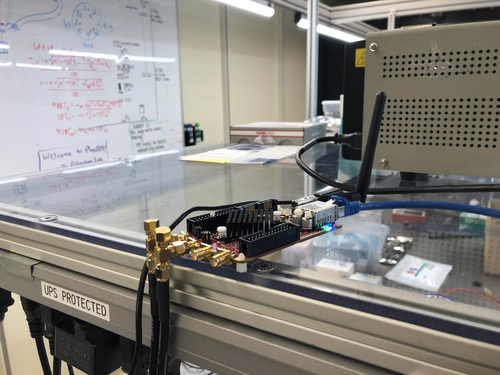
| Attached below are the measurements I took from the FROSTI from 12/18-12/22. |
| Attachment 1: Updated_ASD_plots.pdf
|

|
| Attachment 2: Dark_Noise_Thermal_ASD_plots.pdf
|

|
| Attachment 3: DC_Voltages.pdf
|

|
| Attachment 4: RP-2.jpg
|
|
|
494
|
Sun Dec 22 20:43:35 2024 |
Luis | Update | VAC | MR Testing |
[Luis, Luke]
RGA Volume: T = 23°C, P = 3.0e-9 Torr
Main Volume: T = 22°C, P = 9.90e-9 Torr
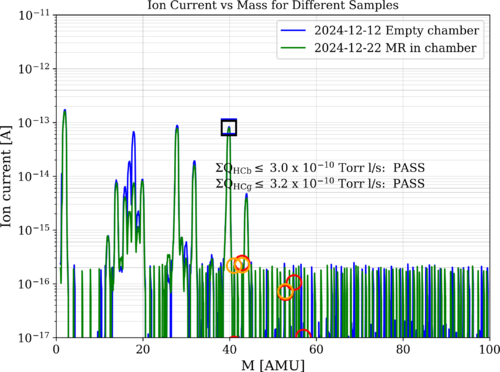
After letting the vacuum cool down for a couple days, we reattached the magnets and sensors, then we performed a RGA scan of the vacuum system, now containing the MR sample. The results are attached below. Something to notice is that we are technically not under UHV, though Luke and I believe the reading of the sensor is not completely accurate since it was still coming to a steady state, further test will be performed when the physics building is open again.
|
| Attachment 1: 2024-12-13_PostBake2_ArO_Degas_overlay.png
|
|
| Attachment 2: 2024-12-22_MR-Bake1_ArO.png
|
|
|
493
|
Thu Dec 19 12:00:44 2024 |
Luke | Update | VAC | End of bake |
The vacuum chamber has stopped baking.
Current state as of 11:40, 12/19/2024:
The gate valve is open, and the filament of the RGA is on.
The temperatures were steady at:
PID right: barrel upper: 129°C, RGA volume: 125°C
PID left: barrel lower: 125°C, Lid: 114°C
The RGA flange was 37°C
Cleanroom was 26°C
Note the upper barrel was very close to the emergency shut off temp of 130°C. In the future we may want to either rewire some of the heating tape or lower the set temperature of the right PID controller.
Luis and I are planning on taking an RGA scan of the MR on Sunday before the campus shuts down for the holidays. |
|
492
|
Wed Dec 18 15:41:56 2024 |
Tyler | Update | TCS | FROSTI RIN |
| [Tyler]
I have begun the (hopefully) final RIN measurements at 3:30 PM today. If you need to go into the cleanroom at any time between now and Sunday (the 22nd), please do not touch the FROSTI, the Red Pitaya, the photodetectors, or any of the wiring. |
|
491
|
Tue Dec 17 13:53:53 2024 |
Luis | Update | VAC | Vacuum system status |
[Luis]
The vacuum system is being baked. I disconnected the digital gages and the magnets, opened the Ar leak and started the bake by taking the temperature from 60C-90C-125C waiting about 15-20 minutes between each interval. The RGA electronics were left on since the temperature of the flange was 36.6C (bellow the 60C threshold) |
|
490
|
Mon Dec 16 21:32:21 2024 |
Luis | Update | VAC | MR Testing |
[Luis, Luke]
The MR material was placed in the vacuum chamber following standard procedures to ensure the vacuum remained as clean as possible. During this process, we only opened the main
volume while keeping the gate valve between the two volumes closed to maintain the UHV in the RGA section.
An RGA scan was taken before this process, this will be used to compare the state of the vacuum with the sample inside to determine whether the MR material is vacuum compatible. |
| Attachment 1: IMG_6011.HEIC
|
|
489
|
Sat Dec 14 07:58:25 2024 |
Luis | Update | VAC | Vacuum sytem staus and Viton O-rings |
| [Luis]
RGA Volume: T = 23°C, P = 1.71e-9 Torr
Main Volume: T = 22°C, P = 5.71e-9 Torr
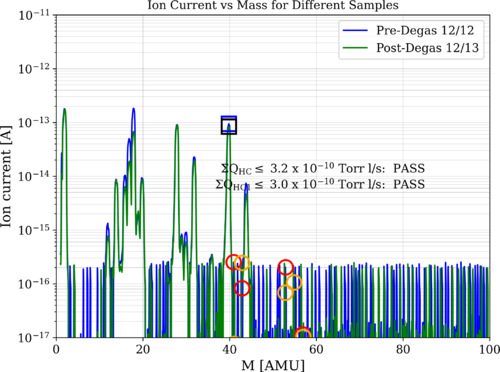
On 12/13 I took another RGA scan to verify the state of the vacuum system and to see whether the degassing of the filament had worked. The results of the scan shows that we did get an overall improvement of the noise levels, though we still have some peaks that are higher than the rest.
Also, while I was around, I transferred the Viton O-rings to a bag and labeled it properly. They are ready to be put into the clean room. |
| Attachment 1: 2024-12-12_PostBake2_ArO_overlay.png
|
|
|
488
|
Thu Dec 12 13:06:39 2024 |
Luis | Update | VAC | RGA Scan and vacuum system updates |
| [Luis, Luke]
RGA Volume: T = 21°C, P = 1.74e-9 Torr
Main Volume: T = 22°C, P = 5.60e-9 Torr
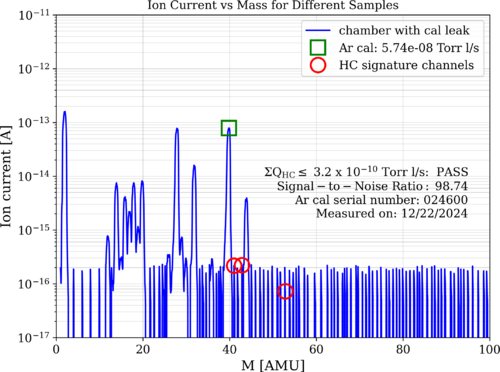
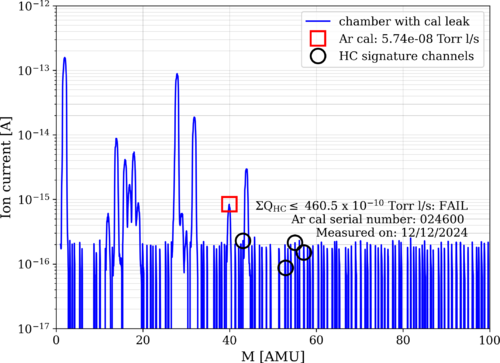
We performed an RGA scan of the system. As we can see, we met cleanliness standards. The S/N ratio was roughly calculated and it is about 100. I will update the code to make this calculation and to have it displayed on the plot in the next scan we perform.
After this, we closed the RGA to the main volume valve, degassed the filament, and after the pressure came down to what it was initially, we reopened the valve. After the degassing, we took another scan. The overlaid plots are attached below.
The noise floor seemed to be about the same. I will take another scan tomorrow to verify whether it was the same or if the system just needed a little more time to be completely clean. |
| Attachment 1: 2024-12-12_PostBake2_ArC.png
|
|
| Attachment 2: 2024-12-12_PostBake2_ArO_overlay.png
|

|
|
487
|
Wed Dec 11 16:06:05 2024 |
Luis | Update | VAC | RGA Status |
[Luis]
I rebooted Spica and I was able to connect the RGA again. After Connecting the RGA, I left the filament on. |
|
486
|
Wed Dec 11 13:39:30 2024 |
Tyler | Update | Electronics | RIN Update 12/11/2024 |
| [Tyler]
Attached below are updated ASD plots for the FROSTI RIN measurements. The parameters set for this are the following:
- DFT Size (N): 16384
- Sampling Frequency (F_s): 7.629 kHz
- Resolution (F_s/N): 0.93
- CH0 DC Voltage w/FROSTI ON: 113.6 mV
- CH0 DC Voltage w/FROSTI OFF: -5.7 mV
- CH1 DC Voltage w/FROSTI ON: 113.0 mV
- CH1 DC Voltage w/FROSTI OFF: -5.7 mV
Each measurement was recorded over a roughly two-day period. Before each spectrum was computed, the time-series signals were AC-coupled (i.e. the DC offset was subtracted from the data). The low-pass filters are still attached for dark and light noise measurements. ADC noise is measured with two 50-ohm terminators attached to the Red Pitaya inputs rather than the IR photodetectors.
|
| Attachment 1: Updated_ASD_plots.pdf
|

|
|
485
|
Thu Dec 5 10:31:13 2024 |
Luis | Update | VAC | RGA Scan and RGA updates |
|
[Luis,Shane]
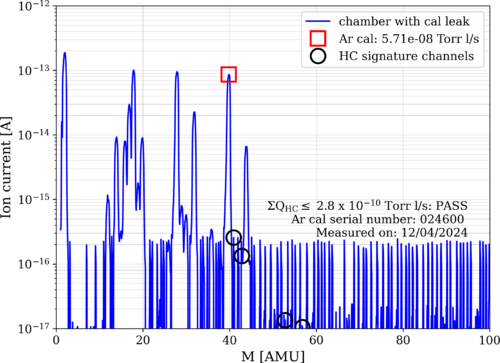
An RGA scan was taken on Dec 4th. The results are attached at the end of the e-log. As we can see, the scan results are under the allowed limits. After the scan, Shane and I worked on the vacuum connections. The filament was turned off, and the RGA was disconnected from Spica.
After we finished the tests, we reconnected the RGA and attempted to turn the filament back on. However, the program was unable to connect to the instrument. We checked for any loose connections but did not find anything. The RGA connection needs to be troubleshot and fixed.
|
| Attachment 1: 2024-12-04_PostBake2_ArO.png
|
|
|
484
|
Wed Dec 4 16:01:23 2024 |
Shane | Update | CDS | Vac serial interfacing troubleshooting update |
| Update on the issue with serial interfacing for the TV 551 turbo pump: Tried a new test today, to see if the commands being sent to the controller were actually getting through at all, since we know that no response is getting back to us. To test this, I sent the start/stop command for the pump, disconnected the serial connection and instead connected the controller to spica so I could run the manufacturer's software, and used the manufacturer's sotware to check the pump status manually. After trying a few variations of this test, during which the pump status did not change at all from 'normal' (meaning the stop command being sent was not actually received), we've concluded that the commands being sent to the pump with the serial comms code are not being received. Further troubleshooting needed. |
|
483
|
Mon Dec 2 13:35:45 2024 |
Luke | Update | General | Clean and bake of Viton O-rings |
[Luke, Luis]
We couldn't access the bake log on the wiki. (see attached) So we looked in the documentation provided on the DCC to find at what temperature to bake the Viton O-rings. We found that we should bake Viton at 180°C for 24 hours.
So we sonic-washed the O-rings, dried them, and then put them in the oven set to the following:
100°C in 15 minutes
100°C for 30 minutes
180°C in 30 minutes
180°C for 24 hours
30°C in 2 hours
Other things of note:
We refilled the water container as it was running out.
The nitrogen used to dry the clean and baked objects is now critically low.
The helium used in leak testing is also quite low (~400 psi).
Regarding the vacuum chamber:
I reattached the pressure gauges to the chamber and gave them about an hour to stabilize. They read out main 8.7e-9, RGA 2.6e-9. Please note these pressures should lower more as we only stopped baking on Saturday afternoon. |
| Attachment 1: image_(2).png
|
.png.png)
|
|
482
|
Mon Dec 2 00:11:23 2024 |
Michael | Update | Interferometer Simulations | Status Update on Toroidal Mirrors Project Work |
| As it has been significant time from my last update on this project, I compiled a few notes about what I have been working on, current issues, and my future plans. The past few weeks have been focused on me attempting to obtain a reliable symbolic expression for mismatch. This is important going forward as it allows us to determine optimal points in the parameter space and the surrounding behavior efficiently without significant computational cost. However this been quite difficult since I've encountered some fundamental discrepancies in the way values like the ABCD matrix and q-parameters are calculated/returned in Finesse. Since I have yet to resolve this, I'm focusing on next steps in developing tools for statistical simulations.
Update Slides |
|
481
|
Sat Nov 30 12:41:42 2024 |
Luke | Update | VAC | Vacuum bake end |
The vacuum chamber has stopped bakeing.
Current state as of 12:10, 11/30/2024:
The gate valve is open, and the filament of the RGA is on.
The temperatures were steady at:
PID right: barrel upper: 128°C, RGA volume: 125°C
PID left: barrel lower: 125°C, Lid: 113°C
The RGA flange was 38°C
Cleanroom was 26°C |
|
480
|
Wed Nov 27 16:23:58 2024 |
Luke | Update | VAC | Started bake |
[Luke, Luis]
The vacuum chamber is currently baking.
We stepped up to 125°C by increments of 30°C starting at 60°C. Everything went fine. After about 20 minutes of the PID controllers being set to 125°C, the flange closest to the RGA was 38°C, so we left it connected.
Current state as of 4:15:
The gate valve is open, and the filament of the RGA is on.
The temperatures are as follows:
PID right barrel upper: 105°C, RGA volume: 125°C
PID left barrel lower: 125°C, Lid: 82°C
The lower temperatures should climb as the whole system heats up.
I will come in Saturday afternoon to turn them off so that we can look at the pressures on Monday. |
|
479
|
Wed Nov 27 13:48:01 2024 |
Tyler | Update | Electronics | RIN Update |
| [Tyler]
I downgraded the Red Pitaya back to OS 2.00-18 due to runtime errors during measurement. Once I did this, the device appeared to work much better than it has the last few weeks. First, it appears we can actually see the cutoff of the added low-pass filters that were added in to the RIN setup. Second, there does appear to be a difference again between the FROSTI ON state versus the dark state (i.e. FROSTI OFF). A long measurement of the ADC noise floor in the current configuration still needs to be recorded, but it does appear that the recent highlighted issues with the Red Pitaya have been solved.
|
| Attachment 1: New_ASD_plots.pdf
|

|
|
478
|
Wed Nov 27 12:27:45 2024 |
Luke | Summary | VAC | Summary of vacuum work |
[Luke, Luis]
Update of current state of vacuum chamber
Current temp: 24°C
Current pressure: Main 1.77e-8, RGA 5.3e-9 [torr] (Gate valve open)
Summary of recent work-->
To try and reduce the leak in the turbo pump by reducing cross-connection, we replaced the copper gasket. This made no improvement to the leaks.
Initially: 1.9e-9 --->
Left side: 1.33e-9, Right side: 3.37e-9 (Gate valve open)
This is still a significant leak. We have tried to tighten the bolts further, but they are as tight as reasonably possible.
Things of note: While examining the knife edges, we found some very slight imperfections on the reducing cross's flange as seen in 474. This could be the source of our leak. We have replaced this gasket 1-2 times already and consistently have a slight leak. This imperfection is on the right side of the flange, which would be consistent with the measurements above.
Unless we want to use the liquid sealant or replace the gasket with an annealed gasket, we could try baking the system again, as this allowed us to reach UHV in the main volume before. It also allowed us to pass the RGA scan, which we are currently failing. (see attached) |
| Attachment 1: 2024-11-27_PostBake1_ArO.png
|

|
|
477
|
Wed Nov 20 12:59:37 2024 |
Tyler | Update | Electronics | RIN Update |
| I went ahead and compared the noise spectrum of the ADC to those of the photodetectors with the FROSTI on and off. As discussed last meeting, it looks like the measurements with the Red Pitaya (RP) are limited by the ADC noise floor. Another avenue to explore in this measurement could be switching to the cymac ADCs. |
| Attachment 1: ASD_plots.pdf
|

|
|
476
|
Wed Nov 20 12:31:24 2024 |
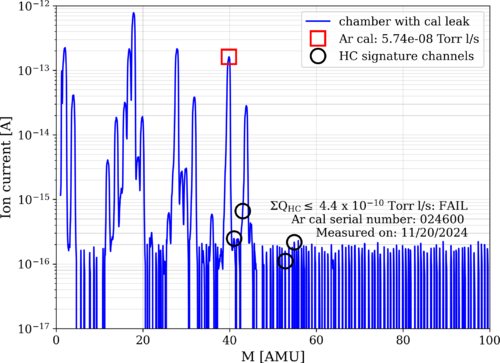
Luis | Update | VAC | Leak test RGA Scan after vacuum repairs |
[Luke, Luis]
After the gasket replacement performed on Monday (11/18/24) we let the vacuum pump down to UHV pressure for a couple days. Today (11/20/24) we measured the pressure to be 5.30*e^-9 with a temperature of 22C, and we performed a leak test and RGA Scan.
Here are the results:
| Connection |
Leak rate (torr) |
| Reducing Cross - TP Left |
4.5e-9 (lowish) |
| Reducing Cross - TP Right |
6.0e-9 (lowish) |
|
| Attachment 1: 2024-11-20_PostBake1_ArO.png
|
|
|
474
|
Tue Nov 19 17:10:34 2024 |
Luke | Update | VAC | Leak check |
Chamber temperature: 23C
Chamber Initial Pressure: ~1.8e-8 main, ~3.5e-8 rga
Did another leak test after monday's work to check how the seal was holding up initial leak was 5.5e-9. I then tried to tighten the bolts a bit more the leak rose to 1.9e-8 about a factor of 4 change.
I checked another flange to confirm that I was preforming the test properly. I measured the elbow to pressure sensor to be 2.2e-11 aproximatly what it was earlier in the month (1.9e-11).
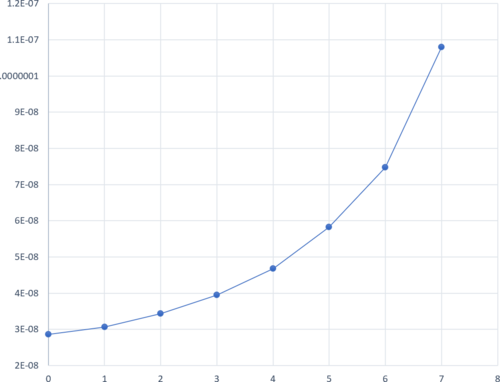
I ran another isolation test. It is still exponetial. Graph attached.
Thoughts:
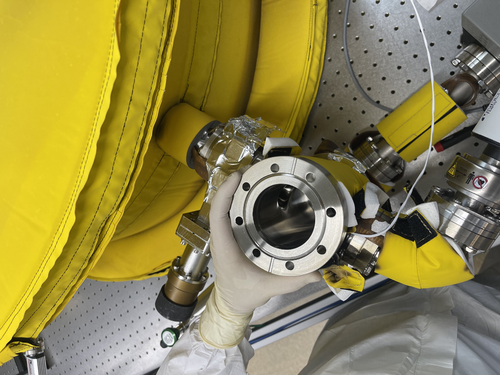
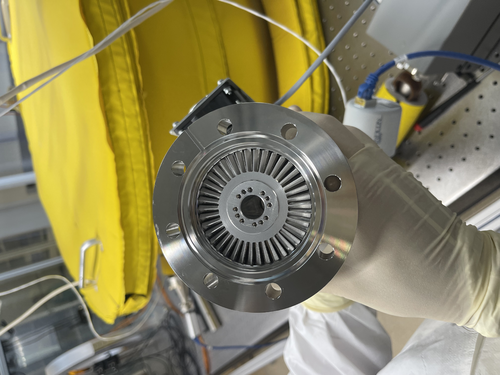
I belive at this point that it is a knife edge issue when replacing the gasket I checked both flanges and the new gasket. The tp knife edge seemed perfectly fine, the gasket had very minor scratches, and the reducing cross had very small imperfections on its edge.
We may want to try and use the liquid sealant or get annealed gaskets for 4.5" |
| Attachment 1: image.png
|
|
| Attachment 2: IMG_5116.jpeg
|
|
| Attachment 3: IMG_5117.jpeg
|
|
|
473
|
Thu Nov 14 11:58:05 2024 |
Shane | Update | CDS | Turbo pump connection troubleshooting |
| Attempted connection to the TV551 turbo pump through Varian/Agilent's software on spica. Successful connection established, and we are able to read out al the readings associated with the pump (status, temperature, etc) through the software, which is actually pretty extensive and well organized. Was able to stop and restart the pump with no issues. Serial communications seem to be working fine, and the current serial settings (baud rate 9600, serial type RS232) all match what the Iolan was expecting with the previous connection test. Also notable: the code used for the previous (failed) connection test is written using 'Letter protocol', which is the older of the two communications protocols supported by these kinds of pumps. This rules out the pump being too old to accept the newer communication format as the issue, since it's the older format being used anyway. Will continue trouble shooting to determine why previous connection test failed. |
|
472
|
Thu Nov 14 10:46:20 2024 |
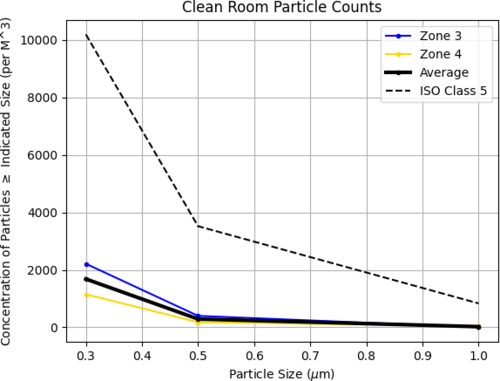
Luke | Summary | Cleanroom | Cleanroom cleaning |
[Luke, Luis, Michael]
cleaning cleanroom and particle count
- 8:30 am: started particle count
- zone 3:
- 0.3 u: 1195
- 0.5 u: 177
- 1.0 u: 132
- zone 4:
- 0.3 u: 619
- 0.5 u: 0
- 1.0 u: 0
- 9:00 am: began surface check and wipedown, including softwalls
- 9:35 am: started vacuuming the floor
- 9:43 am: finished vacuuming the floor
- 9:45 am: started mopping the floor
- 9:55 am: finished mopping the floor
- 9:56 am: started cleaning the buckets
- 10:00 am: started mopping with IPA wipes
- 10:05 am: finished mopping with IPA wipes
- 10:20m: started particle count
- zone 3:
- 0.3 u: 2213
- 0.5 u: 398
- 1.0 u: 0
- zone 4:
- 0.3 u: 1150
- 0.5 u: 177
- 1.0 u: 44
|
| Attachment 1: partical_count_final.png
|
|
|
471
|
Wed Nov 13 14:06:00 2024 |
Luke | Update | General | |
slides |
|
470
|
Wed Nov 13 14:03:32 2024 |
Tyler | Update | Electronics | RIN Update |
| [Tyler]
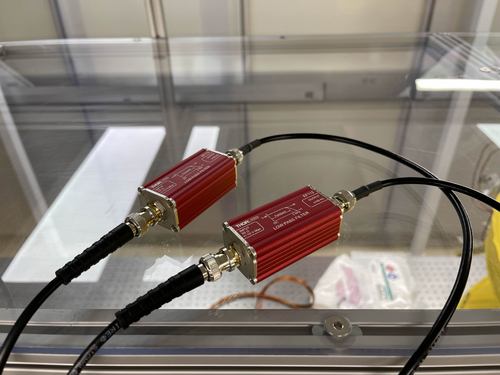
We've added two low-pass filters in hopes of reducing any potential aliasing that may be introducing additional noise into the power spectra for the RIN measurements. It still looks like the noise levels are too high. Attached below are some recent measurements taken with the FROSTI powered on and off.
|
| Attachment 1: IMG_0463.jpg
|
|
| Attachment 2: CH0_CH1_ASDs.pdf
|

|