| ID |
Date |
Author |
Type |
Category |
Subject |
|
430
|
Tue Aug 27 18:37:40 2024 |
Luke | Update | Interferometer Simulations | Ringheater model update |
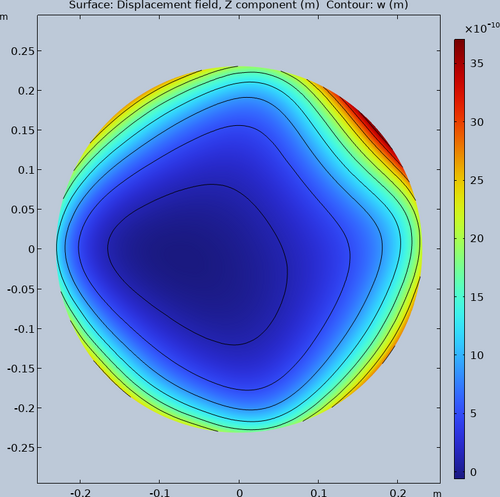
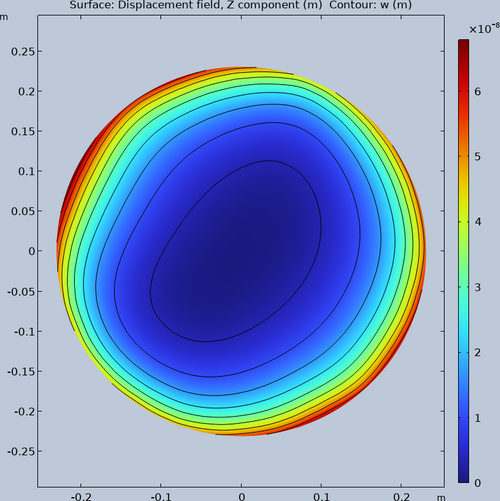
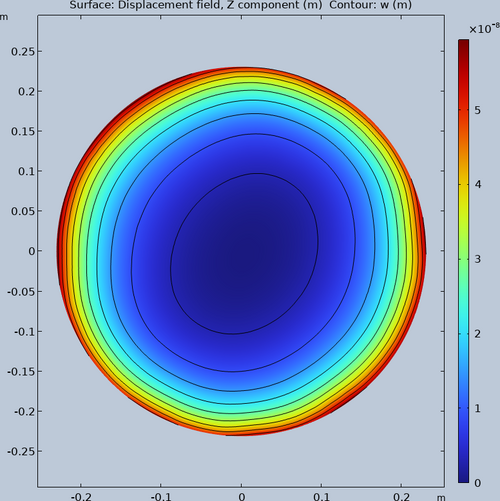
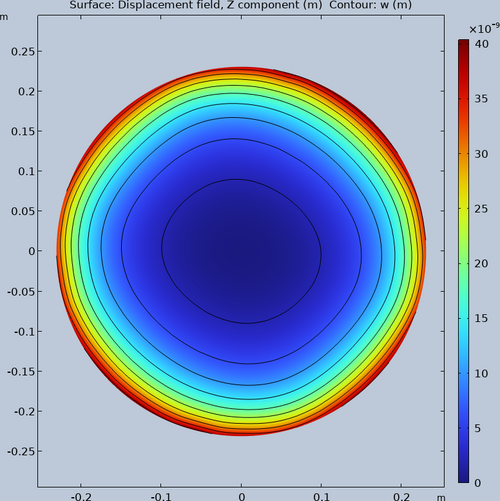
| Updated the model to produce a more circular deformation in the HR surface. The first three attachments are from irradiance patterns gotten from ray tracing. The last is from a pre-defined irradiance pattern. |
| Attachment 1: Initial_1W.png
|
|
| Attachment 2: Increased_rays_100W.png
|
|
| Attachment 3: Increased_rays_more_100W.png
|
|
| Attachment 4: Initial_100W.png
|
|
|
431
|
Thu Aug 29 16:39:34 2024 |
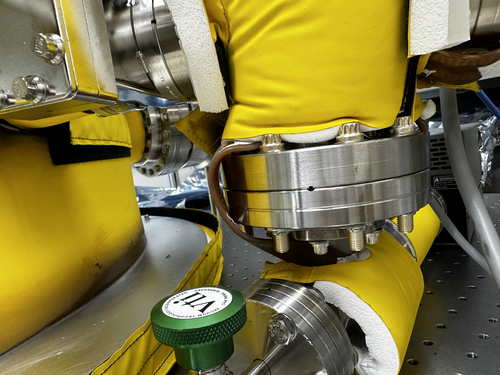
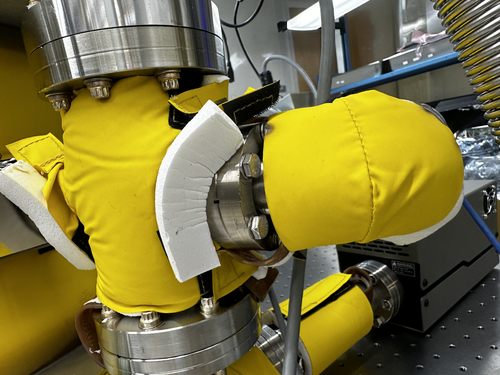
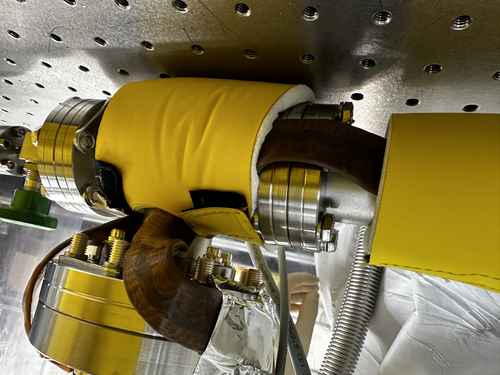
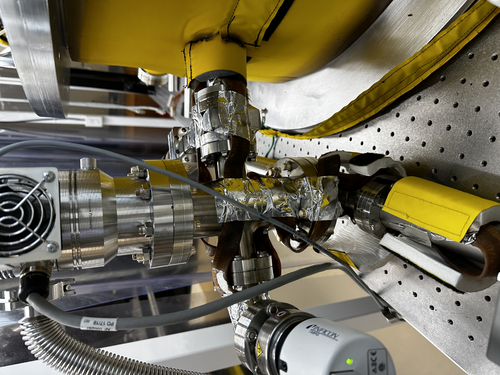
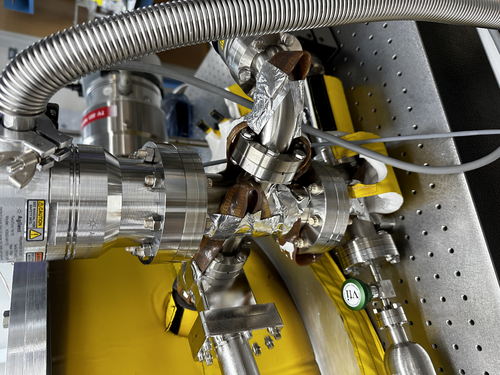
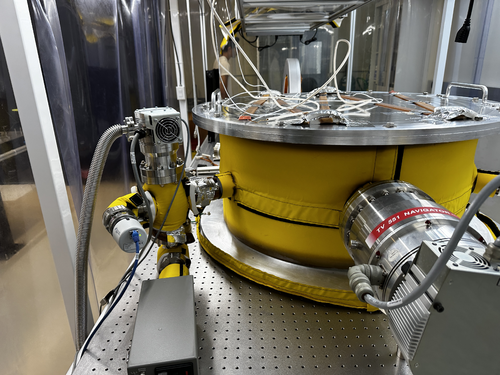
Luke | Update | VAC | Photos of heater tape |
|
| Attachment 1: IMG_2052.jpeg
|
|
| Attachment 2: IMG_2051.jpeg
|
|
| Attachment 3: IMG_2048.jpeg
|
|
| Attachment 4: IMG_2047.jpeg
|
|
| Attachment 5: IMG_2046.jpeg
|
|
| Attachment 6: IMG_2044.jpeg
|
|
|
432
|
Sun Sep 1 16:17:40 2024 |
Luke | Update | VAC | Vacuum chamber leak checking and re-applying heating tape |
[Luke, Luis, Cinthia, Michal, Tyler]
On the 26th Cinthia, Michal, and I took off the insolation on the vacuum chamber and re-routed it to include the new RGA volume.
The next day Luis and I finished up the last of the flanges to be attached. We attached the Pirani gauge with a conical reducing nipple to the 2.75" port on the vacuum chamber. We then preformed the Helium leak testing, both flanges were quite low the 2.75" flange had a leak of 1.68e-10 torr and the 1.33" flange of 5.5e-12 torr. The leak on the 1.33" flange was so low it was difficult to know how much of it was real and how much was just noise. |
|
433
|
Tue Sep 3 15:52:56 2024 |
Luke | Update | VAC | Heater tape initilization |
[Luke, Tyler, Jon]
On the 3rd we set up the pid controllers for the heater tapes and after putting on the insulation we started heating them up. We first brought it to ~50C and let it stabilize, there was about a 6-7 degree difference between the RGA and the barrel temperature, with the barrel being higher. We then brought it to 60 then 70C it still maintained the slight difference between the RGA and barrel temperatures.
Here is a table of the temperatures of the flanges connected to electronics as I left it.
| Electronics |
Temperature (C) |
| Pressure gauge (Main volume) |
58 |
| Main turbo pump |
45 |
| RGA |
37 |
| Pressure gauge (RGA volume) |
39 |
| Cal leak |
40 |
| Mini tubo pump |
36 |
| Pirani gauge |
37 |
Notes: I removed the electronics from the pressure gauge (main volume) because while it was below the required threshold it was still quite high compared to the other flanges. |
|
434
|
Tue Sep 3 18:24:17 2024 |
Tyler | Update | CDS | Cymac Timing Chassis Issue |
| [Tyler, Jon]
The timing chassis used for the cymac has been shut off due to an unknown issue causing its supplied current to fluctuate. All real-time models will be suspended until a solution is found.
|
|
435
|
Fri Sep 6 14:34:52 2024 |
Luke | Update | VAC | Heating tape work |
On the 5th I had tried to start baking the vacuum chamber however certain parts of the chamber were getting too hot and causing the controllers to shut off. So I turned them off so that the next day I could rearrange the temperature probes. I then on the 6th set them up so that instead of overshooting the temperature they would be a little low in places.
After being left over night the cooler parts of the vacuum chamber got much closer to the desired temperature of 120C.
Here is a table of the temperatures of the sections of the chamber. Note: After these measurements were taken the PID controllers were set to 125C.
| Location |
Temperature (C) |
| Lid (PID controller 1 emergency shutoff) |
108 |
| Barrel lower (PID controller 1) |
120 |
| Barrel upper (PID controller 2 emergency shutoff) |
118 |
| RGA volume (PID controller 2) |
120 |
Here is a table of temperature of the flanges that have electronics.
| Electronics |
Temperature (C) |
| Pressure gauge (Main volume) |
79 |
| Main turbo pump |
64 |
| RGA |
51 |
| Pressure gauge (RGA volume) |
55 |
| Cal leak |
47 |
| Mini turbo pump |
50 |
| Pirani gauge |
45 |
Other temperatures of note:
The optical table was about 38C
The cleanroom was around 33C (~91F) |
|
436
|
Mon Sep 9 12:36:45 2024 |
Michael | Update | Interferometer Simulations | Update on Analysis of Mode Mismatch Minimization in A# |
| I have taken a closer look at the solution curve in the mirror parameter space which I have searched, focusing on the "resilience" of specific points, with the plan to analyze how certain conditions of the interferometer change as we move along this solution curve. |
| Attachment 1: SRC_Mode_Mismatch_Update_9_9_24.pdf
|

|
|
438
|
Mon Sep 9 21:02:37 2024 |
Luke | Update | VAC | Steadystate temperature of flanges |
I measured the temperature of the flanges and reconnected the RGA turning on its filament. I then turned off the PID controllers.
Here is a table that has the temperature of the different parts of the vacuum chamber.
| Electronics |
Temperature (C) |
| Pressure gauge (Main volume) |
81 |
| Main turbo pump |
67 |
| RGA |
53 |
| Pressure gauge (RGA volume) |
60 |
| Cal leak |
48 |
| Mini tubo pump |
46 |
| Pirani gauge (1.33") |
46 |
| conical nipple (2.75") |
82 |
| Lid |
112 |
| Barrel lower |
125 |
| Barrel upper |
122 |
| RGA volume |
125 |
| Bottom of chamber |
117 |
|
|
439
|
Mon Sep 16 07:28:16 2024 |
Luke | Update | Interferometer Simulations | Ring heater update |
|
| Attachment 1: 20240916_Ringheater_updates.pptx
|
|
440
|
Mon Sep 16 13:51:23 2024 |
Luis Martin | Update | VAC | RGA Scans |
|
[Luis, Luke}
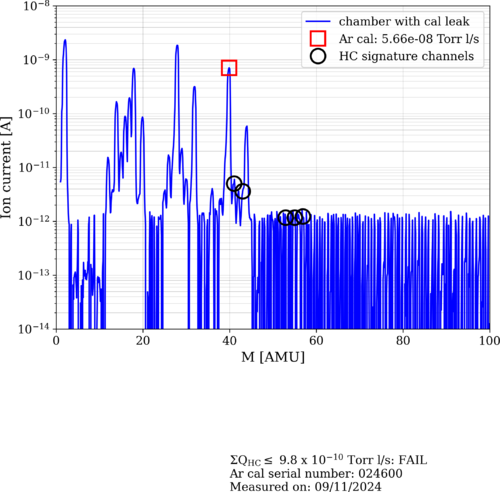
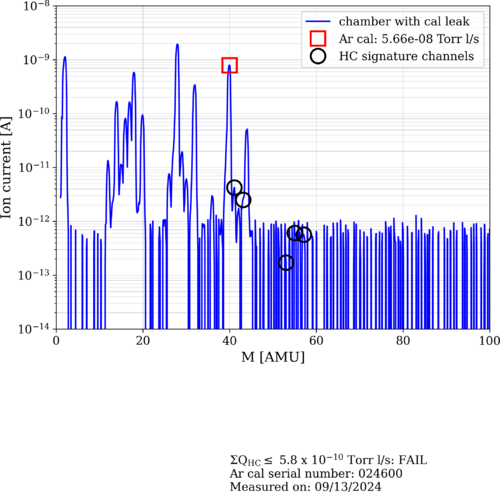
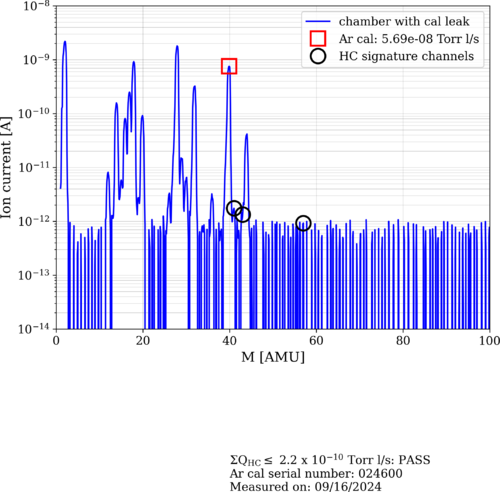
Three RGA scans were taken. The improvement in the amount of HC in the vacuum is visible across the different measurements. Images are attached.
|
| Attachment 1: 2024-09-11_PostBake1_ArO.png
|
|
| Attachment 2: 2024-09-13_PostBake1_ArO.png
|
|
| Attachment 3: 2024-09-16_PostBake1_ArO.png
|
|
|
442
|
Mon Sep 16 14:59:51 2024 |
Tyler | Update | TCS | FLIR RIN Update 09/16 |
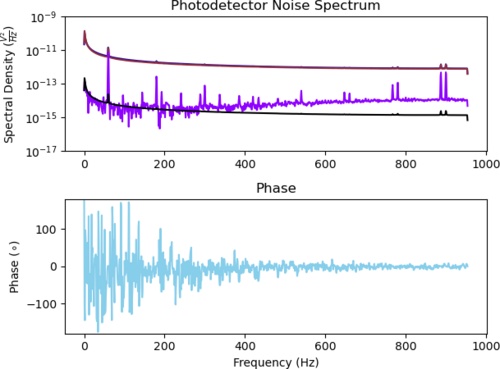
Below is the dark noise spectrum of the Red Pitaya, which was measured over the course of a weekend. Additionally, I have successfully measured a signal from the photodetectors with the FROSTI as the IR source, so it seems there shouldn't be any worry of these particular detectors not being feasible for the RIN measurement. |
| Attachment 1: adc_noise_floor_photodectors.png
|
|
|
443
|
Mon Sep 16 15:18:59 2024 |
Cynthia | Update | Interferometer Simulations | a breakdown of FROSTI and thermal effects and the resulting cavity scan |
|
| Attachment 1: ligo_update_9_16_(1).pdf
|
.png)
|
|
444
|
Mon Sep 23 08:29:49 2024 |
Luke | Update | Interferometer Simulations | Ringheater update |
|
Ringheater Update
If the link does not work here is the file. |
| Attachment 1: 20240923_Update.pptx
|
|
446
|
Mon Sep 23 15:00:41 2024 |
Cynthia | Update | Interferometer Simulations | corrections on assumption for O5 coating |
| The document recording ETM07 and ETM08 coating (T2300093) was discussed:
the current plume files are not necessarily correct in a way that LIGO lab have tried to add it on uncoated ETM such as ETM07 and it does not match what the coated ETM07 would look like.
the plume should be added on top of the uncoated ETM instead of assuming an ideal ETM. According to Garilynn, the imperfection on uncoated ETM matters.
So far the possible ETM data used for O5, ETM 11,14,19, and 20 are all uncoated, and different ways could be used to predict the plume, including the plume data on LIGO dcc or subtract the uncoated data from the coated for O4 ETM and use that as another guessed plume. |
| Attachment 1: Uncoated_S1_ETM07-v2.pdf
|

|
|
447
|
Mon Sep 23 15:11:21 2024 |
Tyler | Update | Scripts/Programs | Effective Emissivity Analysis and RIN Update |
A quick update on the effective emissivity analysis for the CIT FROSTI testing:
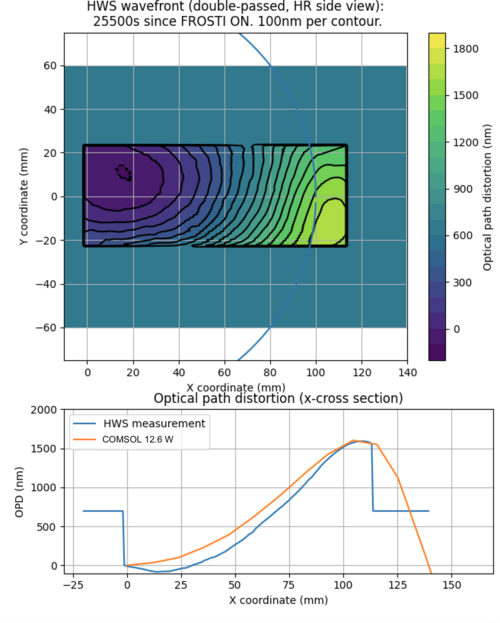
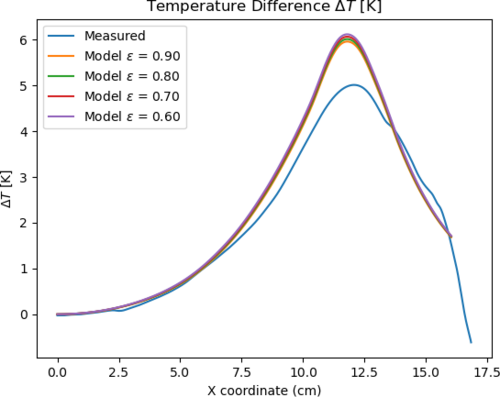
I was able to (roughly) match the OPD data to a referenced COMSOL model, with an applied power of 12.6 W (as seen below). However, when changing the emissivity of the ETM in COMSOL, the dT profiles do not seem to change much. I am not sure as to why this is the case at the moment, and will continue to look further.
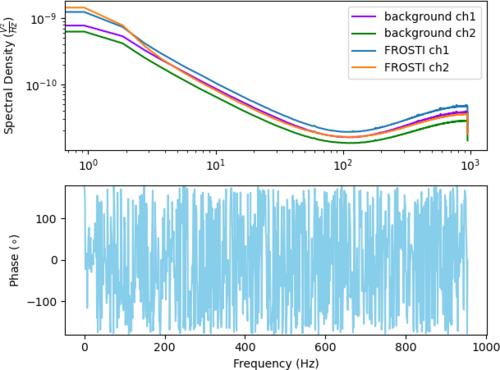
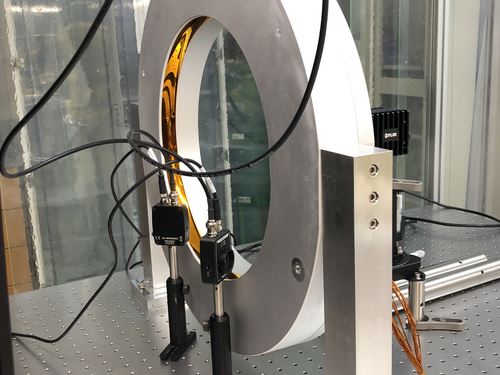
Additionally attached are the current RIN measurements of the FROSTI prototype. Shown is the PSDs of both channels, in reference to their individual backgrounds.
|
| Attachment 1: OPD_Plot.png
|
|
| Attachment 2: Temp_emiss_plot.png
|
|
| Attachment 3: rin_photodectors.png
|
|
| Attachment 4: RIN_setup.jpg
|
|
|
448
|
Wed Sep 25 09:06:09 2024 |
Luis Martin | Update | VAC | RGA Scans |
|
RGA Scan Comparison
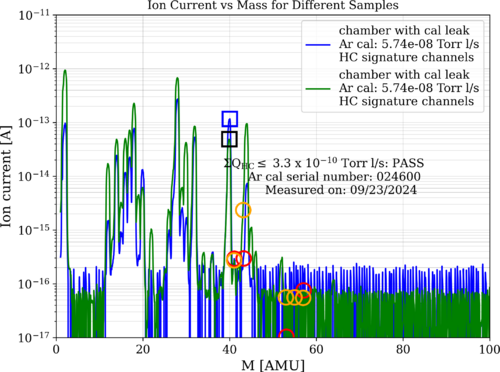
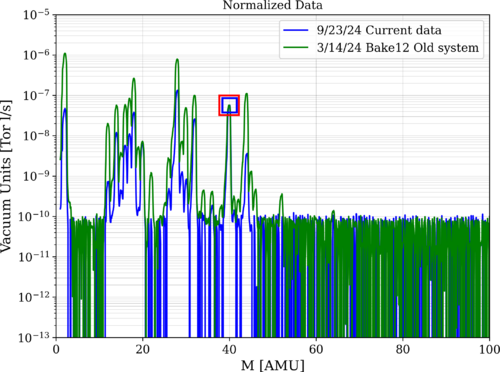
The following images compare the RGA scans from 9/23/24, after the first bake with the new vacuum system, with those from 3/14/24, after bake 12 with the old system.
The first image shows a graph of the raw data and includes the calibrated leak for both curves. As we can see, our new system meets LIGO standards of cleanliness.
The second graph contains the plot of the normalized data.
|
| Attachment 1: 24overlay.png
|
|
| Attachment 2: 24overlayNormalized.png
|
|
|
Draft
|
Tue Oct 1 19:41:23 2024 |
Shane | Update | CDS | CyMAC Timing Chassis Issue |
| [Shane, Luis]
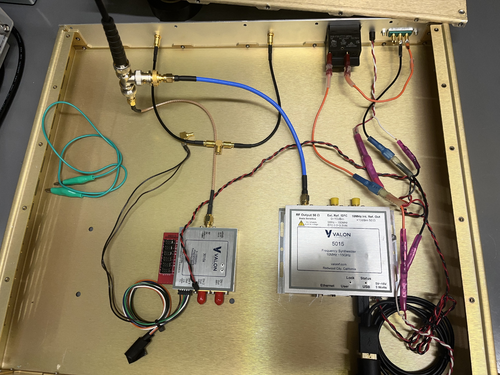
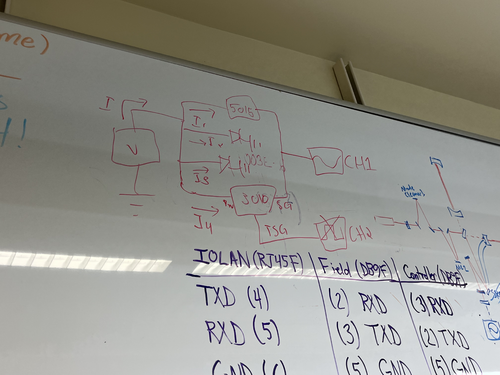
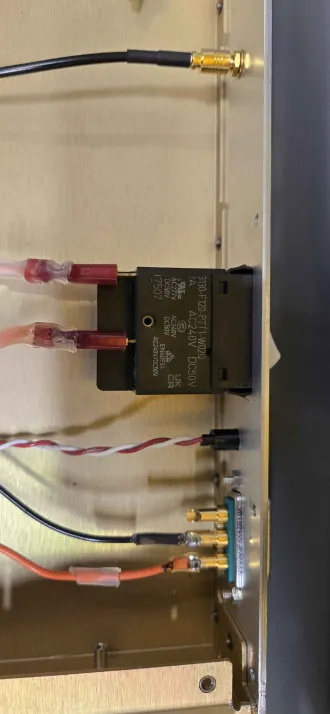
Summary of the issue we've been having with the timing chassis: when we connect only the Valon 5015 to power, the timing signal comes out of it sinusoidal as expected and the status lights are steady and all looks good. As soon as we connect the 3010 to power, the signal (both coming out of the 5015 and coming out of the 3010) go flat and the status lights of the 5015 start to flicker.
We think what may be going on is that the 5015 is drawing just enough power to survive on its own, but when the current gets split to go to the 3010 as well, the 5015 takes more than it needs and becomes overpowered, and thus no longer outputs anything. We want to test further by powering them with two separate power supplies, but we need another one of the power connectors for the 3010 (the only one we have branches out from the connector to the 5015 and we don't want to cut any of the wires).
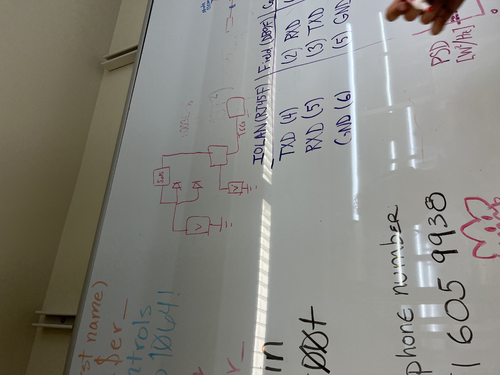
Images of the inside of the chassis, along with two roughly sketched circuit diagrams (one showing the current setup, in which they're powered by the same source, and one showing a possible test set up, in which they're powered separately. |
| Attachment 1: IMG_5917.jpeg
|
|
| Attachment 2: IMG_5803.jpeg
|
|
| Attachment 3: IMG_5804.jpeg
|
|
|
452
|
Wed Oct 2 12:05:42 2024 |
Luke | Update | | Ringheater modeling Update |
Power point slides |
|
453
|
Wed Oct 2 12:20:43 2024 |
Tyler | Update | TCS | Updated FROSTI Analysis 10/02/2024 |
| Attached below are updates on current FROSTI prototype analysis. |
| Attachment 1: FROSTI_Analysis_Updates.pdf
|

|
|
454
|
Wed Oct 2 13:38:00 2024 |
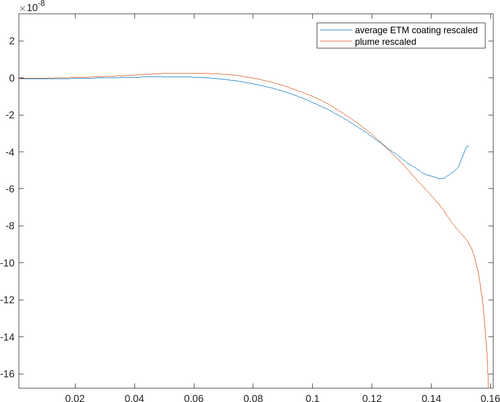
Cynthia | Update | Interferometer Simulations | cavity scan with averaged O4 ETM coating as plume |
|
| Attachment 1: O5plumevsCoating.png
|
|
| Attachment 2: O5CoatAvgpt5.png
|
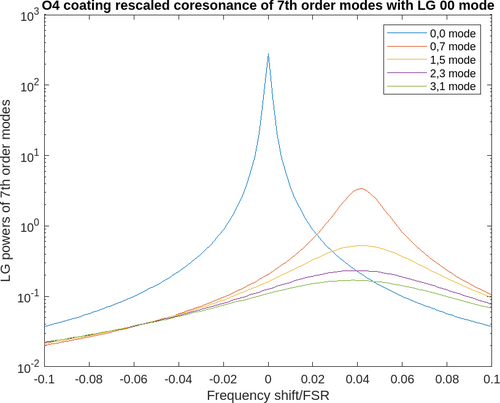
|
| Attachment 3: O5AVgcoatingFROSTIpt5.PNG
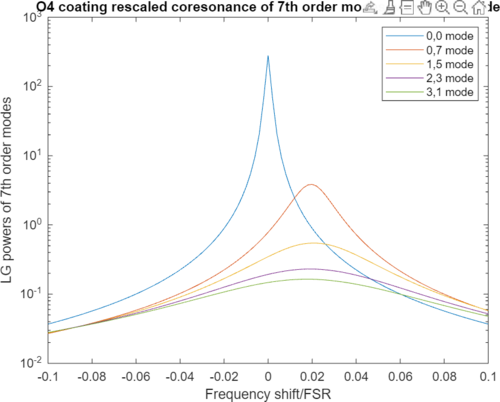
|
|
|
455
|
Wed Oct 2 14:49:59 2024 |
Liu | Update | | FROSTI ETM actuation |
| Proposed FROSTI ETM actuation on the HOM7 resonance.
Animation |
|
456
|
Thu Oct 3 19:35:04 2024 |
Shane | Update | Cleanroom | Cleanroom cleaning and particle count |
|
[Luke, Michael, Cynthia, Mary]
cleaning cleanroom and particle count
- 12:25 pm: started particle count
- zone 3:
- 0.3 u: 4614
- 0.5 u: 872
- 1.0 u:83
- zone 4:
- 0.3 u: 2411
- 0.5 u: 415
- 1.0 u: 83
- 12:48 pm: began surface check and wipedown, including softwalls
- 1:20 pm: started vacuuming the floor
- 1:30 pm: finished vacuuming the floor
- 1:34 pm: started mopping the floor
- 1:40 pm: finished mopping the floor
- 1:40 pm: started cleaning the buckets
- 1:42 pm: started mopping with IPA wipes
- 1:50 pm: finished mopping with IPA wipes
- 1:51 pm: changed sticky floor mats
- 3:44 pm: started particle count
- zone 3:
- 0.3 u: 3207
- 0.5 u: 624
- 1.0 u: 83
- zone 4:
- 0.3 u: 916
- 0.5 u: 83
- 1.0 u: 0
|
|
457
|
Wed Oct 9 13:52:31 2024 |
Tyler | Update | TCS | RIN Update 10/09/2024 |
I tried adjusting the gain settings on the photodetectors to check if this would help improve the RIN spectra measurements. Overall, it doesn't look like it does, and if anything, looks worse. I assume this is so because as the gain is lowered, the amount of detectable signal from the FROSTI becomes smaller and smaller. |
| Attachment 1: RIN_plots_CH0.pdf
|

|
|
458
|
Tue Oct 15 15:27:38 2024 |
Xuesi Ma | Update | ELOG | Timing Chassis Update |
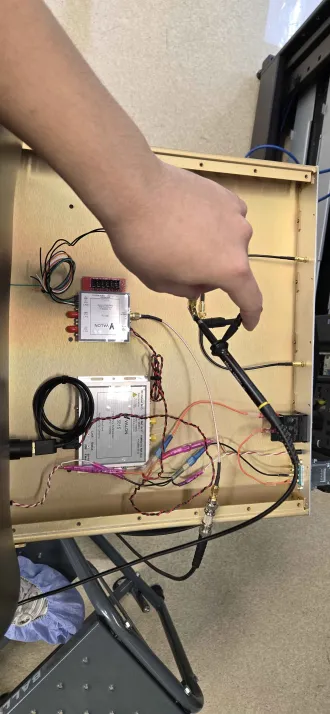
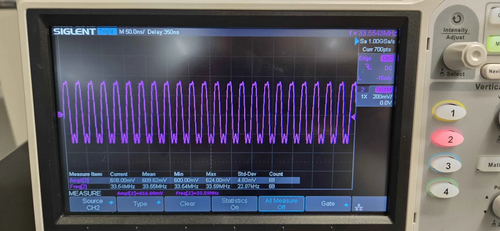
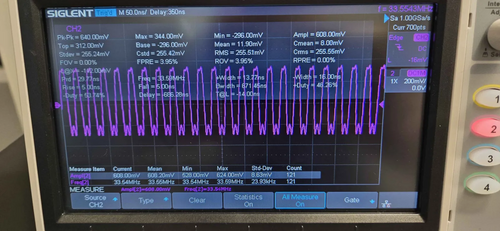
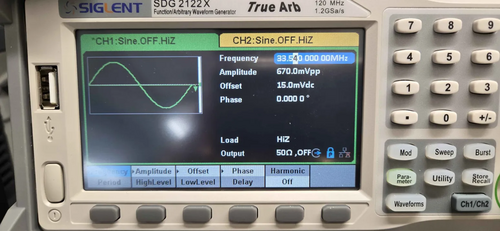
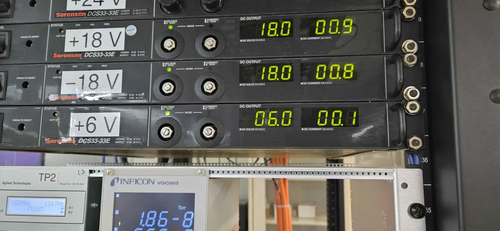
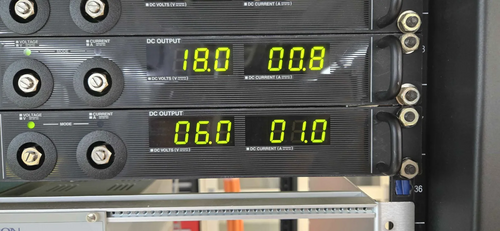
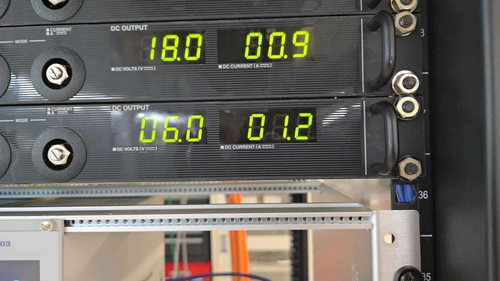
I conducted separate tests on the '5015' and '3010a'. When powered individually, the '5015' outputs a signal at 33.55 MHz with an amplitude of 608 mV. It draws 1 A of current from the power source. The input signal for the '3010a' is 33.54 MHz with an amplitude of 670 mV (peak-to-peak) and a 15 mV DC offset. The output signal from channel 1 is a 65.5 kHz square wave with an amplitude of 3.28 V. The '3010a' draws 0.1 A of current.
Both the '5015' and '3010a' work fine when powered separately. However, when both are powered together, the power source behaves as if there is a short circuit. The current theory is that the switch or breaker is tripping, as it has a 1 A current rating. Since the combined current demand of both devices exceeds 1 A, this may be causing the issue.
Slides for 10/16/2024 Group Meeting |
| Attachment 1: 20241015_134152.mp4
|
| Attachment 2: 20241015_133118.png
|
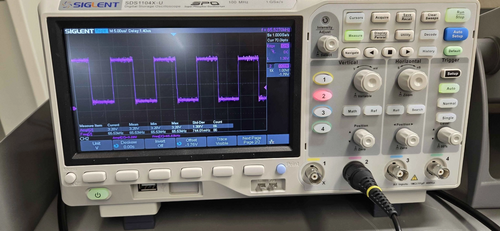
|
| Attachment 3: 20241015_133124.png
|
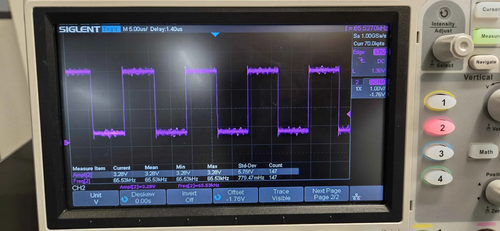
|
| Attachment 4: 20241015_133136.png
|
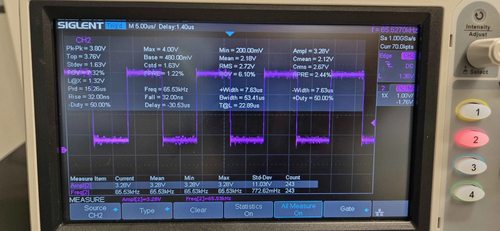
|
| Attachment 5: 20241015_133207.png
|
|
| Attachment 6: 20241015_133543.png
|
|
| Attachment 7: 20241015_133550.png
|
|
| Attachment 8: 20241015_133555.png
|
|
| Attachment 9: 20241015_133300.png
|
|
| Attachment 10: 20241015_133643.png
|
|
| Attachment 11: 20241015_134202.png
|
|
| Attachment 12: 20241015_135353.png
|
|
|
459
|
Wed Oct 16 13:58:59 2024 |
Luis Martin | Update | VAC | RGA Scan |
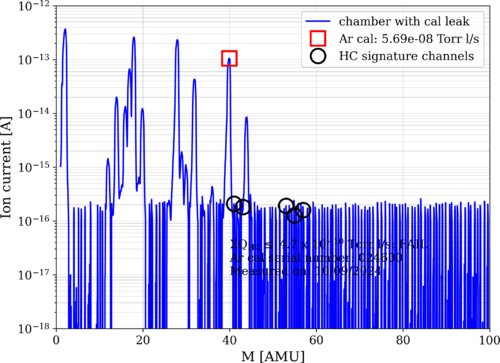
The following figure displays data acquired on 10/09, and it shows that we are no longer below the cleanliness standard. Also, the system's pressure went up to 1.9x10⁻⁸ Torr (approximately 7x10⁻⁹ Torr previously). This might be due to a leak somewhere in the system. More tests will be performed later. |
| Attachment 1: 2024-10-09_PostBake1_ArO.png
|
|
|
460
|
Wed Oct 16 14:13:31 2024 |
Liu | Update | | FROSTI with non uniform absorption scattering sources |
| Slides |
|
461
|
Thu Oct 17 13:24:23 2024 |
Shane | Update | CDS | Timing Chassis issue identified |
|
[Ma, Luis, Shane]
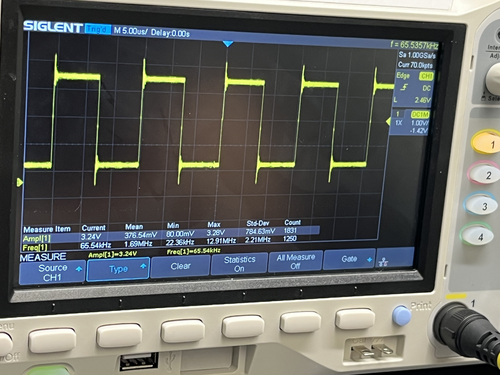
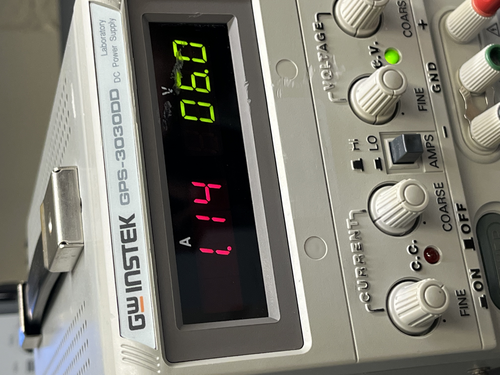
Working theory for the timing chassis issues had been that the 1A breaker was tripping and causing the failure of the Valon 5015 and 3010 to output the timing signal correctly. We just tried bypassing the breaker, running 6 V on the benchtop power supply (set the current limit to 1.5A), with the 5010 generating the sine wave to pass to the 3010. All worked correctly, and there were no issues. Square wave outputted by the 3010 was exactly as desired (image attached) at the correct frequency, and this confirms the issue was the breaker, not the valon 5015. Ready to go ahead with ordering a new replacement breaker.
|
| Attachment 1: IMG_6462.jpeg
|
|
| Attachment 2: IMG_6464.jpeg
|
|
|
462
|
Wed Oct 23 11:48:06 2024 |
Luis Martin | Update | VAC | Leak Test Results |
[Luke, Luis, Mary, Ma]
On 10/22/24 Luke, Ma, Mary and myself ran a leak test, the results are displayed below. The overall pressure of the vacuum was 2.0e-8 and the temperature readings were 26C for the RGA and 25C for the main volume.
| Connection |
Leak rate (torr) |
| Tee - RGA |
9.4e-12 (very low) |
| Tee - Cal leak |
1.58e-11 (very low) |
| Tee - ZLR (2.75"-4.5") |
7.32e-12 (very low) |
| ZLR (2.75"-4.5") - Reducing Cross |
6.9e-11 (low) |
| Cross - Elbow |
2.34e-11 (very low) |
| Elbow - Pressure sensor |
1.96e-11 (very low) |
| Cross - Turbo pump (small) |
1.91e-9 (lowish) |
| Cross - Gate valve |
1.66e-10 (very low) |
| Gate valve - Port |
7.41e-10 (low) |
| Port - ZLR (6.0"-8") |
2.93e-10 (low) |
| ZLR (6.0"-8") - Turbo pump (large) |
6.15e-11 (very low) |
| Port - Pressure sensor |
2.0e-11 (very low) |
| Port - Up to air valve |
1.42e-11 (very low) |
| Port - Blank |
1.27e-11 (very low) |
| Port - Feed through port |
4.59e-12 (very low) |
| Lid - Curtain side |
3.09e-11 (very low) |
| Lid - Wall side |
4.26e-11 (very low) |
|
|
463
|
Wed Oct 23 12:08:36 2024 |
Luis Martin | Update | VAC | RGA Scan |
[Luke, Luis, Mary, Ma]
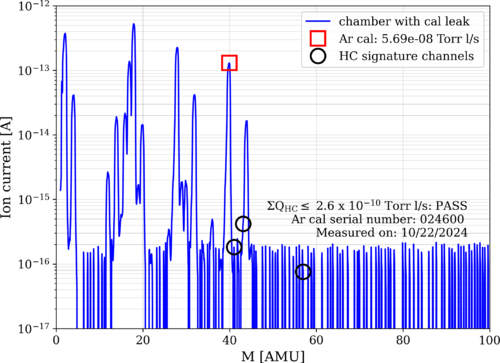
On 10/22/24 Luke, Ma, Mary and myself ran a RGA scan, the results are displayed below. The overall pressure of the vacuum was 2.0e-8 and the temperature readings were 26C for the RGA and 25C for the main volume.
As we can see, the vacuum is passing cleanliness standards again. |
| Attachment 1: 2024-10-22_PostBake1_ArO.png
|
|
|
Draft
|
Wed Oct 23 12:33:54 2024 |
Luke | Update | | Zernike calculation update |
PowerPoint slides new
PowerPoint slides older |
|
465
|
Fri Oct 25 10:56:30 2024 |
Shane | Update | CDS | Timing Chassis fixed and reinstalled |
|
[Ma, Shane]
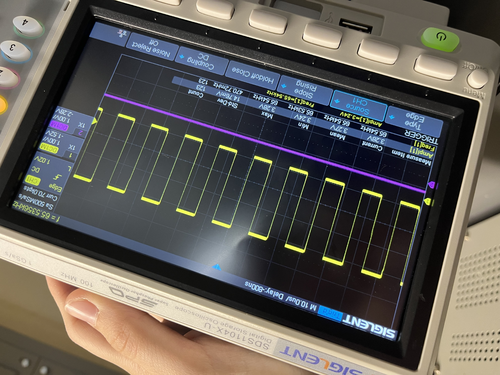
We replaced the 1A breaker in the timing chassis today with a 4A one, and tested that all is working well. The chassis successfully outputted the correct signal (image attached). The real time models have also been restarted and the CyMAC diagnostics screen is showing all green flags. Timing chassis has been closed up and reinstalled in the server rack.
|
| Attachment 1: successful_timing.jpeg
|
|
|
466
|
Tue Oct 29 16:37:35 2024 |
Tyler | Update | Electronics | Red Pitaya OS Update |
The Red Pitaya ecosystem has been upgraded to OS 2.00-35, with a key feature being greater freedom in adjusting the sampling frequency for signal analysis. Before, decimation factors could only be applied if they were a power of 2 (i.e 2,4,8,16,...) up to 65536. Now, the factors can be any power of two up to 16, and any whole number greater than 16 up to 65536. Further information can be found here. |
|
467
|
Tue Nov 5 09:56:04 2024 |
Luis Martin | Update | Clean & Bake | MR Bake |
| [Luke, Luis]
On Friday, 11/1/24, the MR was unpackaged and cleaned under the flow bench. We noticed an ink stain on one of the corners of the material. After wiping it down with IPA and Vector Alpha wipes, the stain was removed. However, the material showed some wear.
After cleaning, we placed it in the bake station and applied a stainless steel baking protocol. On Tuesday, 11/4/24, the material was removed from the furnace and packaged in a static shielding bag. The MR was wrapped in Vector Alpha wipes.
|
|
468
|
Tue Nov 5 11:08:40 2024 |
Luis Martin | Update | VAC | ISO Test |
|
[Luis, Luke, Ma Michael]
The isolation test was conducted on the vacuum system. Every pump was turned off under vacuum, and pressure measurements were taken every minute for 15 minutes. The results are displayed in the sheet linked at the end of this report. The pressure of the main volume dropped very slowly.
The pressure of the RGA Volume dropped in an exponential manner. The test had to be paused at 11 minutes due to concerns about the pressure exceeding the lowest permitted level for the RGA filament.
After the ISO test was performed, we attempted to tighten the bolts of the small turbo pump on the RGA Volume. However, we noticed that the pressure had increased by nearly an order of magnitude, going from 3.27 × 10⁻⁹ Torr to 1.45 × 10⁻⁸ Torr when both volumes were separated. We conducted a leak test for that particular flange and found a concerning leak of 2.15 × 10⁻⁸ Torr, which had previously been 1.9 × 10⁻⁹ Torr. We believe the copper seal was damaged during the ISO test.
View the results sheet
|
|
469
|
Wed Nov 6 13:48:55 2024 |
Liu | Update | Interferometer Simulations | QN modeling update |
| Slides |
|
470
|
Wed Nov 13 14:03:32 2024 |
Tyler | Update | Electronics | RIN Update |
| [Tyler]
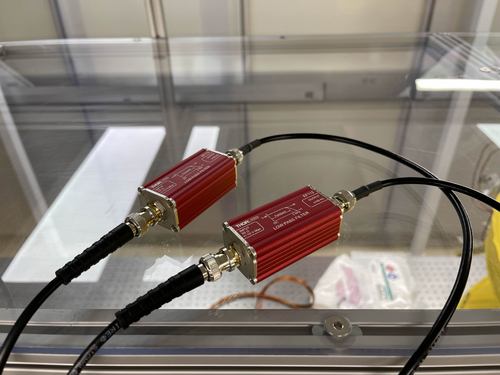
We've added two low-pass filters in hopes of reducing any potential aliasing that may be introducing additional noise into the power spectra for the RIN measurements. It still looks like the noise levels are too high. Attached below are some recent measurements taken with the FROSTI powered on and off.
|
| Attachment 1: IMG_0463.jpg
|
|
| Attachment 2: CH0_CH1_ASDs.pdf
|

|
|
471
|
Wed Nov 13 14:06:00 2024 |
Luke | Update | General | |
slides |
|
473
|
Thu Nov 14 11:58:05 2024 |
Shane | Update | CDS | Turbo pump connection troubleshooting |
| Attempted connection to the TV551 turbo pump through Varian/Agilent's software on spica. Successful connection established, and we are able to read out al the readings associated with the pump (status, temperature, etc) through the software, which is actually pretty extensive and well organized. Was able to stop and restart the pump with no issues. Serial communications seem to be working fine, and the current serial settings (baud rate 9600, serial type RS232) all match what the Iolan was expecting with the previous connection test. Also notable: the code used for the previous (failed) connection test is written using 'Letter protocol', which is the older of the two communications protocols supported by these kinds of pumps. This rules out the pump being too old to accept the newer communication format as the issue, since it's the older format being used anyway. Will continue trouble shooting to determine why previous connection test failed. |
|
474
|
Tue Nov 19 17:10:34 2024 |
Luke | Update | VAC | Leak check |
Chamber temperature: 23C
Chamber Initial Pressure: ~1.8e-8 main, ~3.5e-8 rga
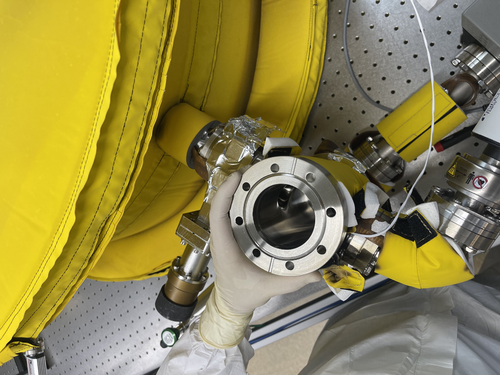
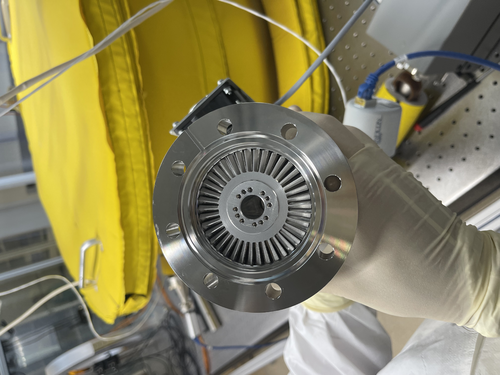
Did another leak test after monday's work to check how the seal was holding up initial leak was 5.5e-9. I then tried to tighten the bolts a bit more the leak rose to 1.9e-8 about a factor of 4 change.
I checked another flange to confirm that I was preforming the test properly. I measured the elbow to pressure sensor to be 2.2e-11 aproximatly what it was earlier in the month (1.9e-11).
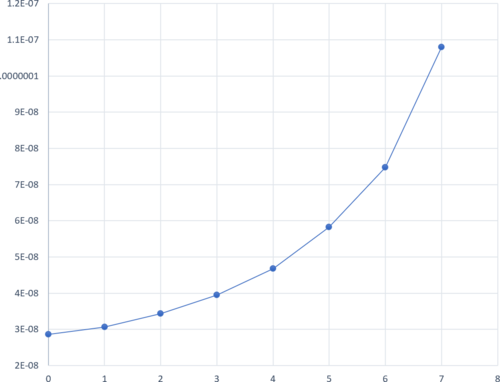
I ran another isolation test. It is still exponetial. Graph attached.
Thoughts:
I belive at this point that it is a knife edge issue when replacing the gasket I checked both flanges and the new gasket. The tp knife edge seemed perfectly fine, the gasket had very minor scratches, and the reducing cross had very small imperfections on its edge.
We may want to try and use the liquid sealant or get annealed gaskets for 4.5" |
| Attachment 1: image.png
|
|
| Attachment 2: IMG_5116.jpeg
|
|
| Attachment 3: IMG_5117.jpeg
|
|
|
476
|
Wed Nov 20 12:31:24 2024 |
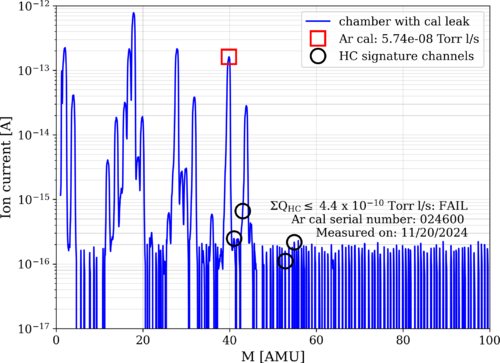
Luis | Update | VAC | Leak test RGA Scan after vacuum repairs |
[Luke, Luis]
After the gasket replacement performed on Monday (11/18/24) we let the vacuum pump down to UHV pressure for a couple days. Today (11/20/24) we measured the pressure to be 5.30*e^-9 with a temperature of 22C, and we performed a leak test and RGA Scan.
Here are the results:
| Connection |
Leak rate (torr) |
| Reducing Cross - TP Left |
4.5e-9 (lowish) |
| Reducing Cross - TP Right |
6.0e-9 (lowish) |
|
| Attachment 1: 2024-11-20_PostBake1_ArO.png
|
|
|
477
|
Wed Nov 20 12:59:37 2024 |
Tyler | Update | Electronics | RIN Update |
| I went ahead and compared the noise spectrum of the ADC to those of the photodetectors with the FROSTI on and off. As discussed last meeting, it looks like the measurements with the Red Pitaya (RP) are limited by the ADC noise floor. Another avenue to explore in this measurement could be switching to the cymac ADCs. |
| Attachment 1: ASD_plots.pdf
|

|
|
479
|
Wed Nov 27 13:48:01 2024 |
Tyler | Update | Electronics | RIN Update |
| [Tyler]
I downgraded the Red Pitaya back to OS 2.00-18 due to runtime errors during measurement. Once I did this, the device appeared to work much better than it has the last few weeks. First, it appears we can actually see the cutoff of the added low-pass filters that were added in to the RIN setup. Second, there does appear to be a difference again between the FROSTI ON state versus the dark state (i.e. FROSTI OFF). A long measurement of the ADC noise floor in the current configuration still needs to be recorded, but it does appear that the recent highlighted issues with the Red Pitaya have been solved.
|
| Attachment 1: New_ASD_plots.pdf
|

|
|
480
|
Wed Nov 27 16:23:58 2024 |
Luke | Update | VAC | Started bake |
[Luke, Luis]
The vacuum chamber is currently baking.
We stepped up to 125°C by increments of 30°C starting at 60°C. Everything went fine. After about 20 minutes of the PID controllers being set to 125°C, the flange closest to the RGA was 38°C, so we left it connected.
Current state as of 4:15:
The gate valve is open, and the filament of the RGA is on.
The temperatures are as follows:
PID right barrel upper: 105°C, RGA volume: 125°C
PID left barrel lower: 125°C, Lid: 82°C
The lower temperatures should climb as the whole system heats up.
I will come in Saturday afternoon to turn them off so that we can look at the pressures on Monday. |
|
481
|
Sat Nov 30 12:41:42 2024 |
Luke | Update | VAC | Vacuum bake end |
The vacuum chamber has stopped bakeing.
Current state as of 12:10, 11/30/2024:
The gate valve is open, and the filament of the RGA is on.
The temperatures were steady at:
PID right: barrel upper: 128°C, RGA volume: 125°C
PID left: barrel lower: 125°C, Lid: 113°C
The RGA flange was 38°C
Cleanroom was 26°C |
|
482
|
Mon Dec 2 00:11:23 2024 |
Michael | Update | Interferometer Simulations | Status Update on Toroidal Mirrors Project Work |
| As it has been significant time from my last update on this project, I compiled a few notes about what I have been working on, current issues, and my future plans. The past few weeks have been focused on me attempting to obtain a reliable symbolic expression for mismatch. This is important going forward as it allows us to determine optimal points in the parameter space and the surrounding behavior efficiently without significant computational cost. However this been quite difficult since I've encountered some fundamental discrepancies in the way values like the ABCD matrix and q-parameters are calculated/returned in Finesse. Since I have yet to resolve this, I'm focusing on next steps in developing tools for statistical simulations.
Update Slides |
|
483
|
Mon Dec 2 13:35:45 2024 |
Luke | Update | General | Clean and bake of Viton O-rings |
[Luke, Luis]
We couldn't access the bake log on the wiki. (see attached) So we looked in the documentation provided on the DCC to find at what temperature to bake the Viton O-rings. We found that we should bake Viton at 180°C for 24 hours.
So we sonic-washed the O-rings, dried them, and then put them in the oven set to the following:
100°C in 15 minutes
100°C for 30 minutes
180°C in 30 minutes
180°C for 24 hours
30°C in 2 hours
Other things of note:
We refilled the water container as it was running out.
The nitrogen used to dry the clean and baked objects is now critically low.
The helium used in leak testing is also quite low (~400 psi).
Regarding the vacuum chamber:
I reattached the pressure gauges to the chamber and gave them about an hour to stabilize. They read out main 8.7e-9, RGA 2.6e-9. Please note these pressures should lower more as we only stopped baking on Saturday afternoon. |
| Attachment 1: image_(2).png
|
.png.png)
|
|
484
|
Wed Dec 4 16:01:23 2024 |
Shane | Update | CDS | Vac serial interfacing troubleshooting update |
| Update on the issue with serial interfacing for the TV 551 turbo pump: Tried a new test today, to see if the commands being sent to the controller were actually getting through at all, since we know that no response is getting back to us. To test this, I sent the start/stop command for the pump, disconnected the serial connection and instead connected the controller to spica so I could run the manufacturer's software, and used the manufacturer's sotware to check the pump status manually. After trying a few variations of this test, during which the pump status did not change at all from 'normal' (meaning the stop command being sent was not actually received), we've concluded that the commands being sent to the pump with the serial comms code are not being received. Further troubleshooting needed. |
|
485
|
Thu Dec 5 10:31:13 2024 |
Luis | Update | VAC | RGA Scan and RGA updates |
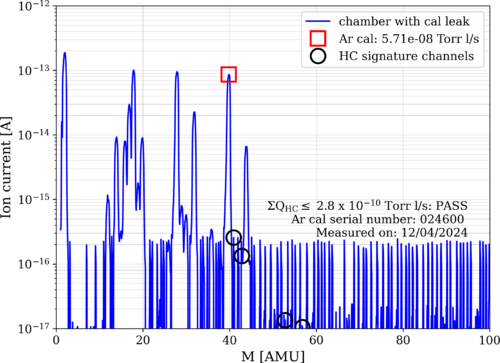
|
[Luis,Shane]
An RGA scan was taken on Dec 4th. The results are attached at the end of the e-log. As we can see, the scan results are under the allowed limits. After the scan, Shane and I worked on the vacuum connections. The filament was turned off, and the RGA was disconnected from Spica.
After we finished the tests, we reconnected the RGA and attempted to turn the filament back on. However, the program was unable to connect to the instrument. We checked for any loose connections but did not find anything. The RGA connection needs to be troubleshot and fixed.
|
| Attachment 1: 2024-12-04_PostBake2_ArO.png
|
|
|
486
|
Wed Dec 11 13:39:30 2024 |
Tyler | Update | Electronics | RIN Update 12/11/2024 |
| [Tyler]
Attached below are updated ASD plots for the FROSTI RIN measurements. The parameters set for this are the following:
- DFT Size (N): 16384
- Sampling Frequency (F_s): 7.629 kHz
- Resolution (F_s/N): 0.93
- CH0 DC Voltage w/FROSTI ON: 113.6 mV
- CH0 DC Voltage w/FROSTI OFF: -5.7 mV
- CH1 DC Voltage w/FROSTI ON: 113.0 mV
- CH1 DC Voltage w/FROSTI OFF: -5.7 mV
Each measurement was recorded over a roughly two-day period. Before each spectrum was computed, the time-series signals were AC-coupled (i.e. the DC offset was subtracted from the data). The low-pass filters are still attached for dark and light noise measurements. ADC noise is measured with two 50-ohm terminators attached to the Red Pitaya inputs rather than the IR photodetectors.
|
| Attachment 1: Updated_ASD_plots.pdf
|

|
|
487
|
Wed Dec 11 16:06:05 2024 |
Luis | Update | VAC | RGA Status |
[Luis]
I rebooted Spica and I was able to connect the RGA again. After Connecting the RGA, I left the filament on. |