| ID |
Date |
Author |
Type |
Category |
Subject |
|
167
|
Wed Jul 19 19:10:31 2023 |
Pamella | Update | FLIR | Data plot FLIR and updates. |
[Pamella]
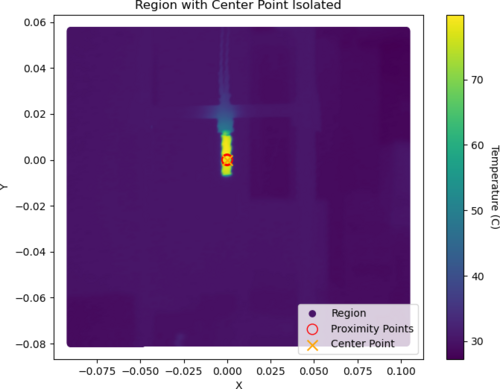
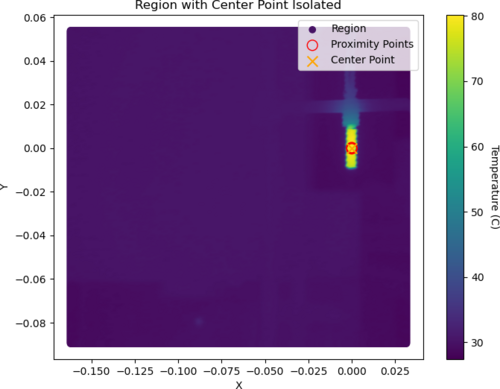
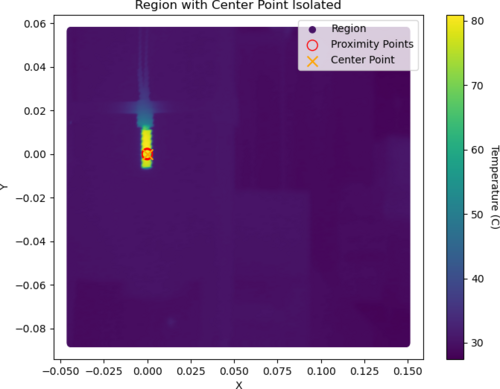
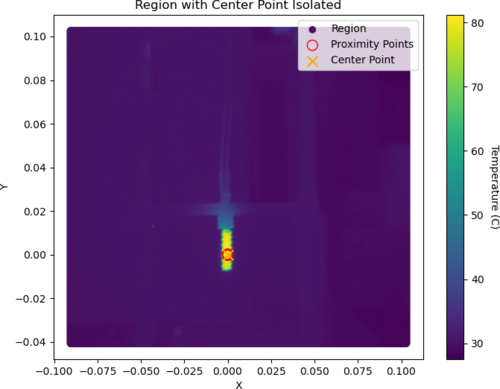
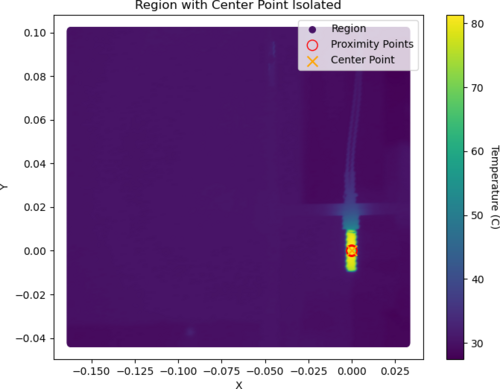
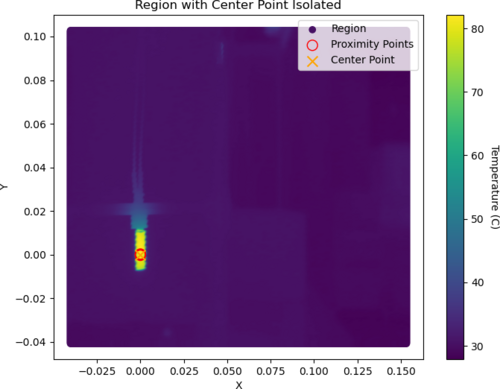
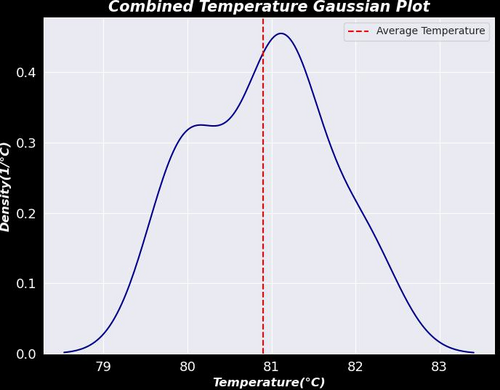
- Today I was able to plot a graph for the isolation point on the center of the heater. I got data from six different positions on the screen (I shifted the all coordinates). I extracted the data for the center point and plot the Gaussian with this extracted data for temperature. I attached the all plots below
- Also I took a snap using the black wall and with the heater at 120.1 C (0.30 A) try to have less noise but
we can see this is not very good. At this temperature, we have noise on the top and I don't understand why because the heater is not in this location. I attached a snap below.
|
| Attachment 1: 1_Isolated_Plot.png
|
|
| Attachment 2: 2_Isolated_Plot.png
|
|
| Attachment 3: 3_Isolated_Plot.png
|
|
| Attachment 4: 4_Isolated_Plot.png
|
|
| Attachment 5: 5_Isolated_Plot.png
|
|
| Attachment 6: 6_Isolated_Plot.png
|
|
| Attachment 7: Gauss.plot-2.jpeg
|
|
| Attachment 8: AcquisitionImage(Jul-19-2023_17_01).jpg
|
.jpg.png)
|
|
169
|
Thu Jul 20 21:00:23 2023 |
Pamella | Update | FLIR | Data plot FLIR and updates about the black body |
[Pamella]
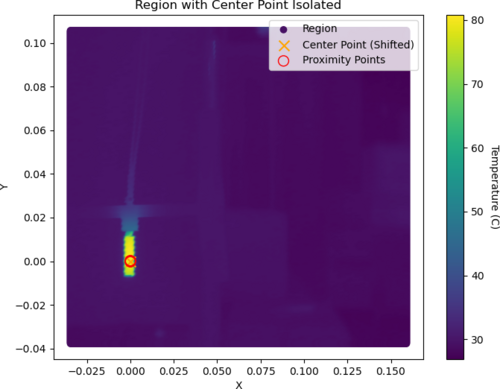
- Today I got more data to plot the Gaussian. So I took more snaps in each position for the six different spots than we be using to have a better calibration of the FLIR collected data. I attached the new plot below. Also, I did the same plot for each region as on the Elog 167 but I have more than 20 pics because I was using a big number of data so I just attached one example below.
To access the Elog, click here.
- Also I think we have some real (non-ideal) heat diffusion by the screen and not noise like Dr. Richardson suggested. I was testing today and we can see the first pic before the start heater source turns on, the second pic is at 120.2 C (0.31A) with the heater on and the last pic is after the heater source cooled back down to room temperature. Just in the second pic, we have a strong spot on the top, so it looks like a non-ideal diffusion.
|
| Attachment 1: AcquisitionImage(Jul-20-2023_13_09).jpg
|
.jpg.png)
|
| Attachment 2: AcquisitionImage(Jul-20-2023_13_15).jpg
|
.jpg.png)
|
| Attachment 3: AcquisitionImage(Jul-20-2023_13_33).jpg
|
.jpg.png)
|
| Attachment 4: AcquisitionData-480(Jul-20-2023_SIsolated_Plot.png
|
|
| Attachment 5: Gauss.plot-2.jpeg
|

|
|
181
|
Fri Jul 28 18:03:07 2023 |
Pamella | Update | FLIR | Final plot - FLIR |
[Pamella]
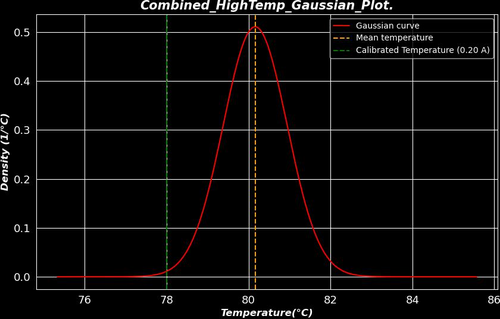
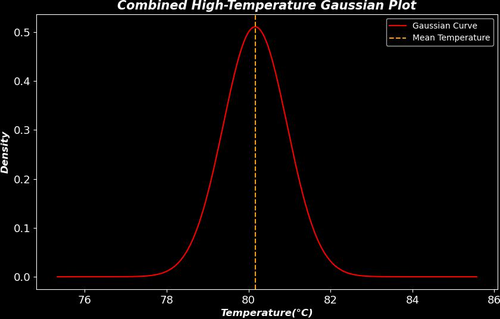
- I was able to plot the final result with the data to the heater. I attached below the "3Combined_HighTemp_Gaussian_Plot." in this plot we can see better behavior on the Gaussian compared to the plot in ELOG 169, I was using the same data but with a different approach. On the ELOG 169, we have the center point isolated data and this new plot is the temperature more than 70 C isolated because we have a very good heater temperature distinguish do background. For the all data I got I was using a power current of 0.20A. To get the data I waited for 30 minutes until the heater became stable and after that, I started to take snaps, I took more than one snap for each one different 6 positions on the screen, and We can see the positions on ELOG 167.
- Also I attached the calibration plot ("calibration_plot") between the measurements with the FLIR camera and thermocouple and we can see looks good if we compare the final plot.
- For better analyses I attached a plot of the calibration line on the Gaussian plot.
- To do: I will finish the final report.
|
| Attachment 1: 29Combined_HighTemp_Gaussian_Plot.jpg
|
|
| Attachment 2: 3Combined_HighTemp_Gaussian_Plot.jpg
|
|
| Attachment 3: calibration_plot(2).png
|
.png.png)
|
|
536
|
Mon Mar 10 21:13:12 2025 |
Nathan | Update | VLC Update | PDH Lock Progress and Next Steps |
| Progress update: Photodiode is set up, need to set up DC bias tee, EOM has 400-600nm wavelength range with a resonance frequency of 0.1-100MHz. Additionally need to connect the DC bias to SR560, put it in low pass, then connect to the function generator and connect it to oscilloscope to observe. Once everything looks good and working, need to connect the driver and we can start actuating on the cavity ETM. |
| Attachment 1: thumbnail_(2).jfif
|
| Attachment 2: thumbnail_(4).jfif
|
| Attachment 3: thumbnail_(5).jfif
|
| Attachment 4: Visible_Light_Optical_Cavity_(2).pdf
|
.png)
|
|
537
|
Mon Mar 10 21:32:29 2025 |
Nathan | Physics | Electronics | Beam Profiling and PBS Measurements |
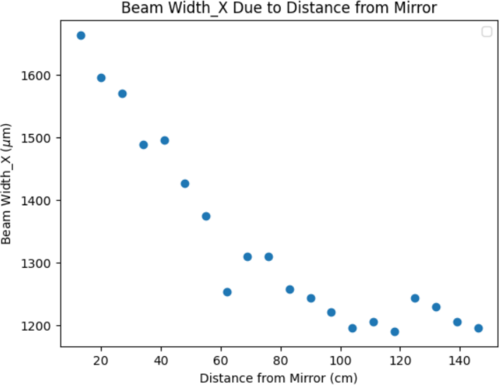
| Beam wasn't diverging, however maybe was about to diverge when measurements stopped? Will discuss the PBS measurements and how the voltage changed due to the wave plate. |
| Attachment 1: Beam_Profiling_2_20_(2).pdf
|
.png)
|
| Attachment 2: beamprfl.png
|
|
| Attachment 3: thumbnail_(6).jfif
|
|
551
|
Tue Apr 8 20:04:35 2025 |
Nathan | Update | VLC Update | PDH Lock Progress |
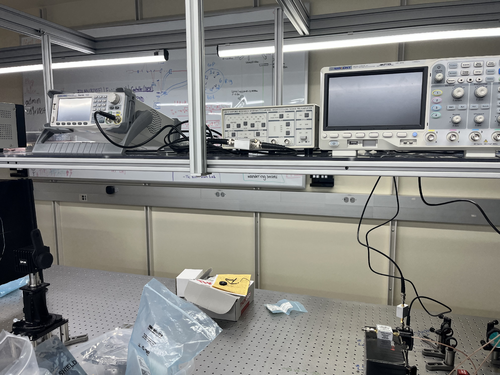
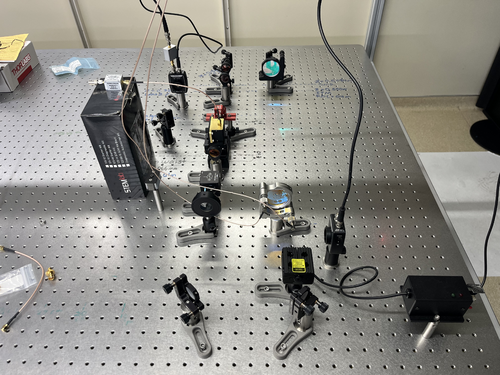
| Connected the DC bias and mixer. Need to connect signal generator now to RF Amp and mixer, and also need to connect power supply. After that will see if I can get a detection on the oscilloscope and if so will set up the driver. [Photos attached] |
| Attachment 1: IMG_5450.jpeg
|
|
| Attachment 2: IMG_5449.jpeg
|
|
|
560
|
Tue Apr 22 13:00:04 2025 |
Nathan | Update | VLC Update | Photodiode signal check and additional signal check due to 20Mhz signal and amplifier |
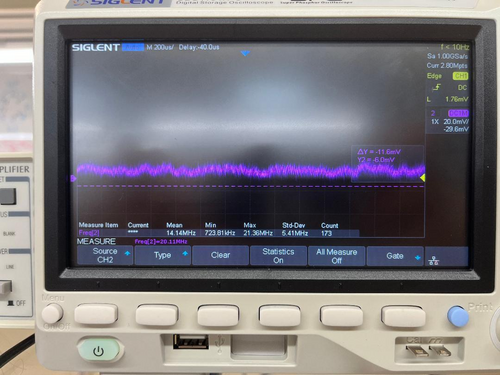
| In general, photodiode was able to achieve signal. Below are the voltage signals and frequency measurements of the photodiode with the dc bias and amplifier connected to the EOM (Vpp = 2mV for first and Vpp= 1 for second). Also I need assistance in using the PZT driver. |
| Attachment 1: thumbnail_(8)_(1).jpg
|
_(1).jpg.png)
|
| Attachment 2: vpp.jpg
|
|
|
317
|
Tue Feb 6 22:40:25 2024 |
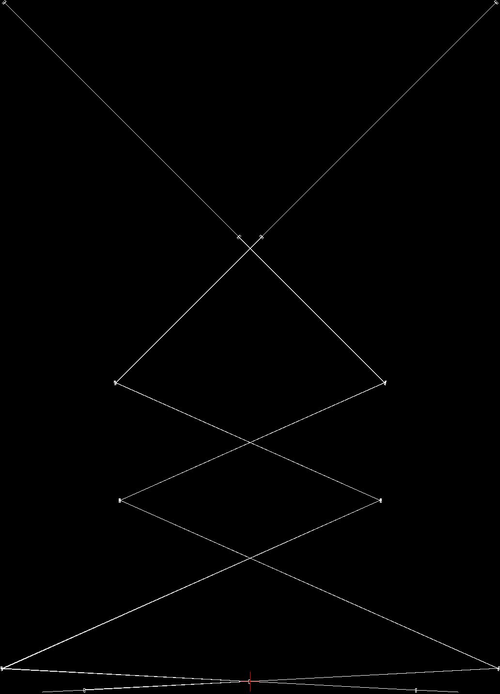
Michael | Update | Scripts/Programs | Long Crab 1 Design Created In Gtrace |
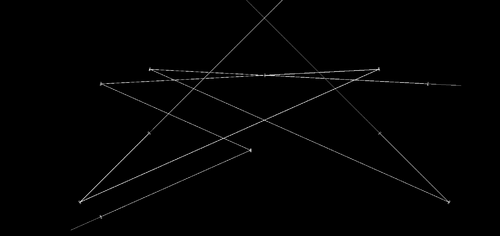
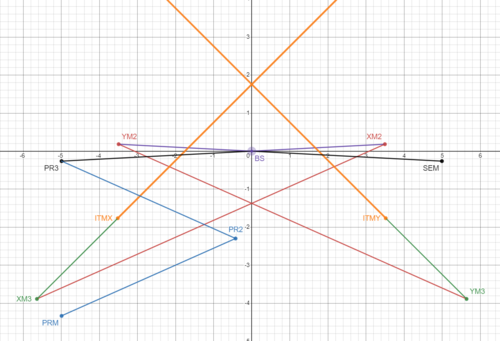
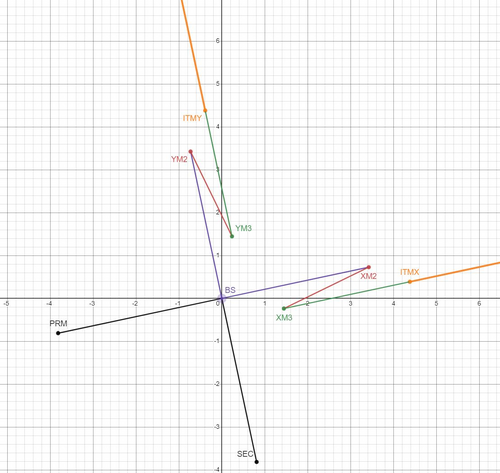
| Worked on and completed the python code for the simulation of the Long Crab 1 layout for Cosmic Explorer basing off of Pooyan's original work with the Crab 1 layout. From here I'll look into creating the shoelaces layouts. |
| Attachment 1: Long_Crab1.png
|
|
| Attachment 2: long_crab_1_desmos.PNG
|
|
|
322
|
Tue Feb 13 04:05:32 2024 |
Michael | Update | Interferometer Simulations | Shoelaces 1 Layout Simulated in GTrace |
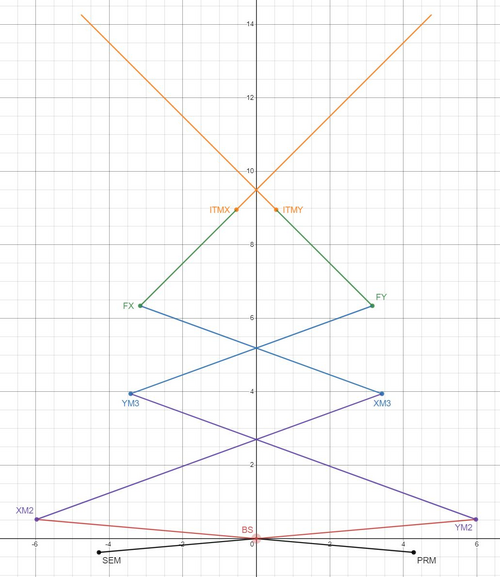
| I've worked on and have completed a first simulation of Cosmic Explorer's Shoelaces 1 layout. This is based off of Pooyan's original work with Gtrace much like the Long Crab 1 layout I worked on last week. This layout will allow me to quickly created the alternate shoelaces layouts. I've included an image of the dxf, and a desmos model for reference. |
| Attachment 1: shoelaces1_dxf.JPG
|
|
| Attachment 2: shoelaces1_desmos.JPG
|
|
|
334
|
Wed Feb 21 23:15:07 2024 |
Michael | Update | Interferometer Simulations | Long Shoelaces 1 Layout Created in Gtrace and Fixed Ghosting in Beamsplitter |
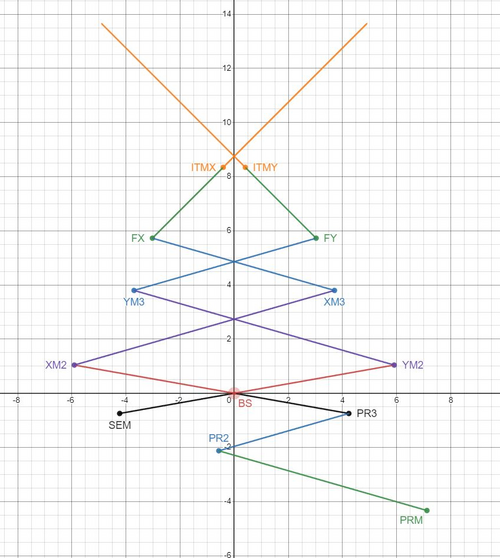
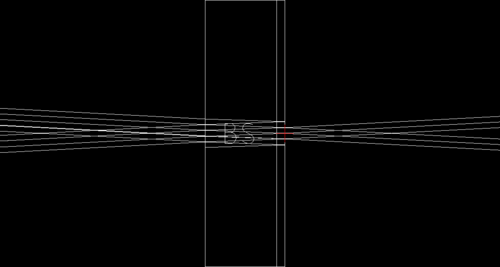
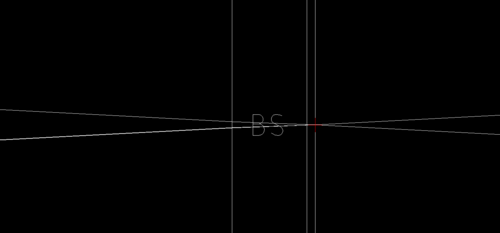
| I have created the long shoelaces 1 layout for cosmic explorer using gtrace, a slight modification from the shoelaces 1 layout design. I also modified the simulation code slightly to remove ghosting effects in the beamsplitter. Originally the python code specified that the HR and AR sides of the beamsplitter both have the same transmission/reflection. I modified this to the ideal case of: Refl_AR = 0, Trans_AR = 1. I have attached two images below to show the before and after effect of this modification. |
| Attachment 1: long_shoelaces1_desmos.JPG
|
|
| Attachment 2: AR_side_with_reflection.PNG
|
|
| Attachment 3: AR_side_without_reflection.PNG
|
|
|
342
|
Tue Feb 27 03:26:28 2024 |
Michael | Update | Interferometer Simulations | Reverse aLIGO Layout Created in Gtrace |
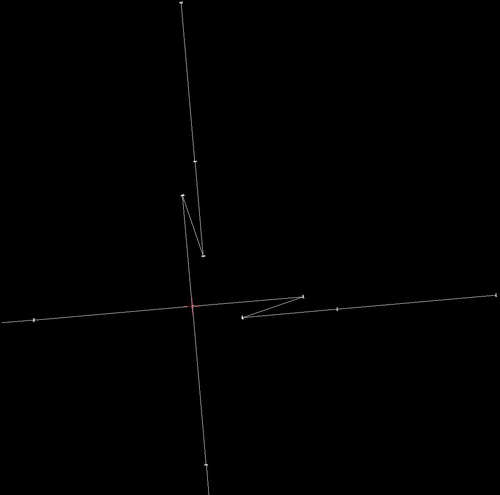
| I've created the simulation for reverse aLIGO layout in gtrace. Attached are the desmos model and the output dxf file. From here Pooyan and I plan to create a brief report of our progress to the CE optical design group. |
| Attachment 1: reverse_aligo_desmos.JPG
|
|
| Attachment 2: reverse_aligo_dxf.JPG
|
|
|
357
|
Sun Apr 7 13:42:51 2024 |
Michael | Update | Interferometer Simulations | Update on status of gtrace project |
| [Pooyan, Michael]
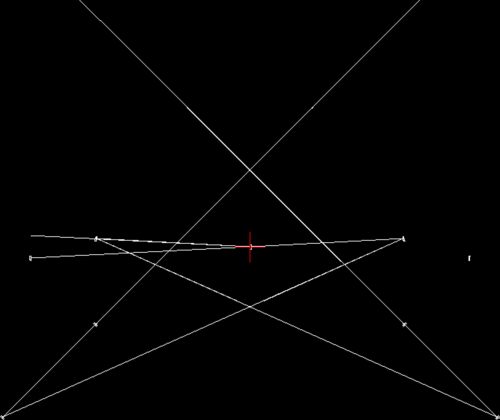
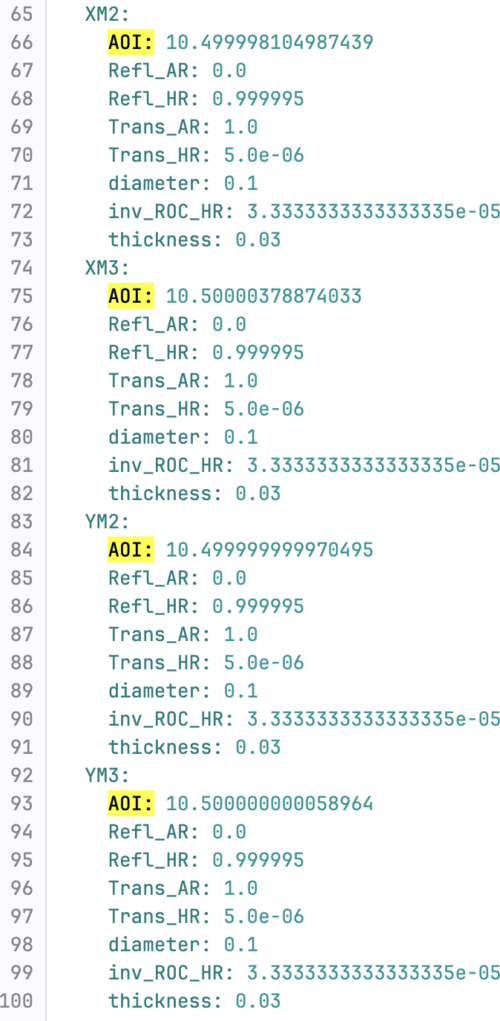
After meeting and discussing the current state of our work with Prof. Fulda a few weeks ago, we have decided that the best next step for the gtrace project is its integration into finesse work. Our first step towards this integration involved creating a sequential beam trace in contrast to the previous non sequential gtrace simulations. A sequential beam trace not only allows for faster runtimes of the simulation (<1 second) but also allows for more direct reading of certain beam parameters (beam size, gouy phase, and angle of incidence). The sequential model was created alongside a yaml output which provides values of parameters, now including the angle of incidence on a mirror.
Last Monday, Pooyan gave a report to the Cosmic Explorer optical design team on the current state of our project and the ultimate goal of our work. During the same meeting another group working in the optical design team presented their own work with gtrace and optical design, focusing more on optimization of parameters based on desired beam sizes at each mirror. It might be a good idea to begin attempting to bring our individual projects together to allow for collaboration and further developments.
Currently, only the crab1 layout has a sequential trace model. Pooyan is currently working on creating a finesse model for crab1 to serve as a proof of concept for how gtrace could be integrated with finesse by providing useful values such as angles of incidence. |
| Attachment 1: Sequential_beam_trace_crab1.png
|
|
| Attachment 2: angle_of_incidence_yaml_example.png
|
|
|
397
|
Mon Jul 8 12:26:10 2024 |
Michael | Update | Interferometer Simulations | Minimizing Astigmatic Effects in the SRC of LIGO |
| This is the first look and analysis of the effects of astigmatism in the aLIGO optical layout which can lead to mode mismatch and therefore increased losses into higher order modes. Specifically I am currently looking at measuring the effect of changing the radii of curvature of the SRC mirrors https://docs.google.com/presentation/d/1qhIehqyNukg4g8S2fqfQZz83yr9aB76tEa6fn2J-TrM/edit?usp=sharing |
|
409
|
Mon Jul 15 15:52:40 2024 |
Michael | Update | Interferometer Simulations | aLIGO locking with varying SRC mirrors and measuring mode mismatch |
|
| Attachment 1: SRC_Astigmatism_Analysis_7_15_24.pdf
|

|
|
Draft
|
Sun Aug 4 09:01:01 2024 |
Michael | Update | Interferometer Simulations | Update on SRC Mode Mismatch Analysis |
| An update on my analysis to minimize mode mismatch/scattering by introducing toroidal mirrors to the SRC. |
| Attachment 1: SRC_Mode_Mismatch_Update_8_2_24.pdf
|

|
| Attachment 2: SRC_Mode_Mismatch_Update_8-12-24.pdf
|

|
|
436
|
Mon Sep 9 12:36:45 2024 |
Michael | Update | Interferometer Simulations | Update on Analysis of Mode Mismatch Minimization in A# |
| I have taken a closer look at the solution curve in the mirror parameter space which I have searched, focusing on the "resilience" of specific points, with the plan to analyze how certain conditions of the interferometer change as we move along this solution curve. |
| Attachment 1: SRC_Mode_Mismatch_Update_9_9_24.pdf
|

|
|
482
|
Mon Dec 2 00:11:23 2024 |
Michael | Update | Interferometer Simulations | Status Update on Toroidal Mirrors Project Work |
| As it has been significant time from my last update on this project, I compiled a few notes about what I have been working on, current issues, and my future plans. The past few weeks have been focused on me attempting to obtain a reliable symbolic expression for mismatch. This is important going forward as it allows us to determine optimal points in the parameter space and the surrounding behavior efficiently without significant computational cost. However this been quite difficult since I've encountered some fundamental discrepancies in the way values like the ABCD matrix and q-parameters are calculated/returned in Finesse. Since I have yet to resolve this, I'm focusing on next steps in developing tools for statistical simulations.
Update Slides |
|
523
|
Tue Feb 25 01:37:00 2025 |
Michael | Update | Interferometer Simulations | Updates and Current Next Steps for Toroidal Mirrors Project |
| Since the previous discussion of this project, I've worked on building finesse models to verify mathematical results which model the astigmatism in a two mirror system which we attempt to minimize. This left us with a single condition for an output non-astigmatic beam. However, as can be seen in finesse simulations, there does exist other configurations which have a negligibly small astigmatism, which we may want to consider. Below I've attached the link to my overleaf project which has some updated information which I plan on discussing.
https://www.overleaf.com/project/67968921426e61d5b2fd8c96 |
|
548
|
Tue Apr 8 00:17:01 2025 |
Michael | Update | Interferometer Simulations | Squeezing Performance Graphs for Case With and Without Toroidal Mirrors in LIGO |
| I've created some graphs for the frequency dependent observed squeezing level in LIGO for both the nominal case and the case where we include toroidal mirrors, giving some interesting results. https://docs.google.com/presentation/d/1RBr47hNaxFTdGrwys5ZCUEUOgVOVHmZ2B_5EQwY62IY/edit?usp=sharing |
|
556
|
Mon Apr 21 16:56:42 2025 |
Michael | Update | Interferometer Simulations | Fixed Observed Squeezing Curve for Toroidal Mirror Case |
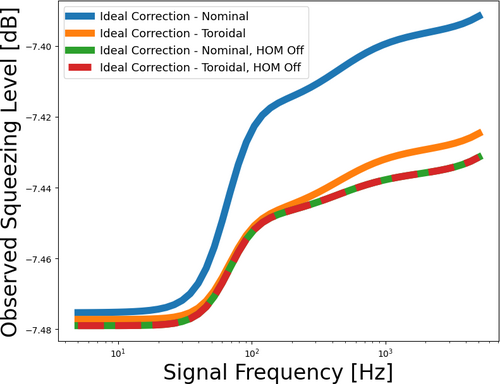
| We've resolved the issue with the observed squeezing curve for the toroidal mirror case showing worse performance at lower frequencies and better performance at higher frequencies compared to the nominal case. This issue was caused by the beam parameter at the squeezer being fixed before changing the radii of curvature of the mirrors. This has been changed to be fixed after changing the mirrors, and we see an improvement in the toroidal mirror case. |
| Attachment 1: updated_observed_squeezing_plot.png
|
|
|
571
|
Tue May 6 13:07:34 2025 |
Michael | Update | Interferometer Simulations | Initial Convergence Plots for Toroidal Mirrors Project |
|
| Attachment 1: Convergence_Plots_5_6_25.pdf
|

|
| Attachment 2: Convergence_Plots_5_6_25-1.pdf
|

|
| Attachment 3: aperture_num_points_convergence.png
|
|
|
582
|
Mon May 26 23:24:33 2025 |
Michael | Update | Interferometer Simulations | Initial Monte Carlo Simulations for Toroidal Mirrors Project |
| I've run an initial Monte Carlo simulation for statistical comparison of toroidal mirrors for the dual FROSTI TCS case. Below is the link to the slides.
slideshow |
|
634
|
Tue Aug 26 12:18:36 2025 |
Michael | Update | Interferometer Simulations | Squeezing Plots for SRC Parameter Space |
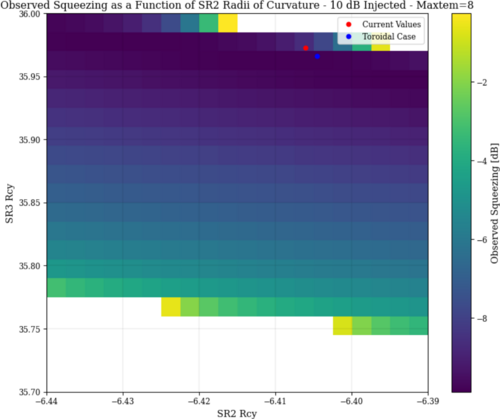
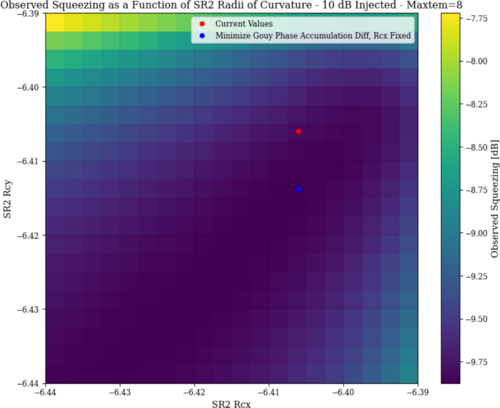
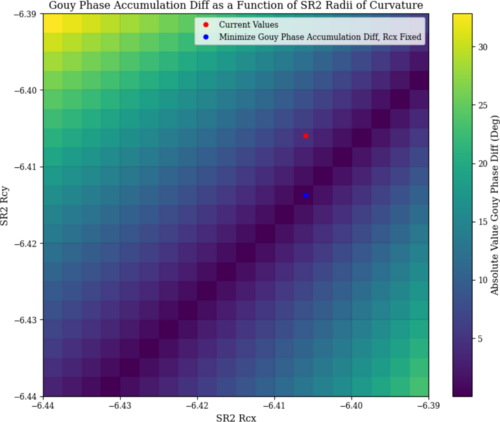
| I've run a few plots of observed squeezing in the LIGO interferometer to fully ensure that the point we have selected is the optimal point for squeezing. Contrary to what I expected, there seems to be much more degenerate "optimal" configurations. While the toroidal case may be near optimal, it seems that the solution we found for a non astigmatic beam is not the only one. I will further explore this space to find more optimal/tolerant positions, which I see evidence of.
Additionally, as observed squeezing is computational expensive to compute, I found that the difference in round-trip gouy phase accumulation between the x and y planes is a good approximation for an optimal squeezing state, which I believe makes physical sense. This may be helpful to quickly compute other optimal conditions. |
| Attachment 1: Screenshot_2025-08-26_at_12-16-01_LIGO_Project_Log_-_Google_Docs.png
|
|
| Attachment 2: Screenshot_2025-08-26_at_12-16-32_LIGO_Project_Log_-_Google_Docs.png
|
|
| Attachment 3: Screenshot_2025-08-26_at_12-17-26_LIGO_Project_Log_-_Google_Docs.png
|
|
|
Draft
|
Thu Oct 23 11:34:05 2025 |
Michael | Update | Interferometer Simulations | Updated Exploration into Different SRC Mirror Configurations for Improved Squeezing |
|
| Attachment 1: Update_Slides_10_23_25.pdf
|

|
| Attachment 2: Update_Slides_10_30_25.pdf
|

|
|
680
|
Thu Feb 5 13:49:31 2026 |
Michael | Update | Interferometer Simulations | Updating Squeezing Mode Matching Logic |
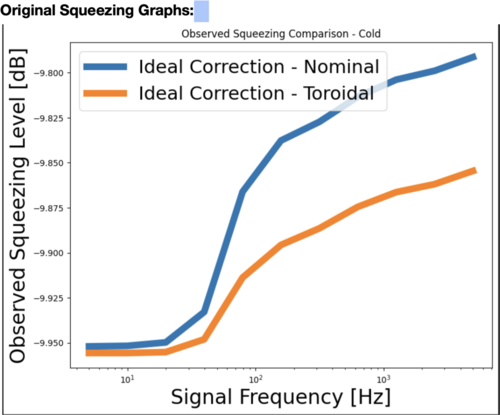
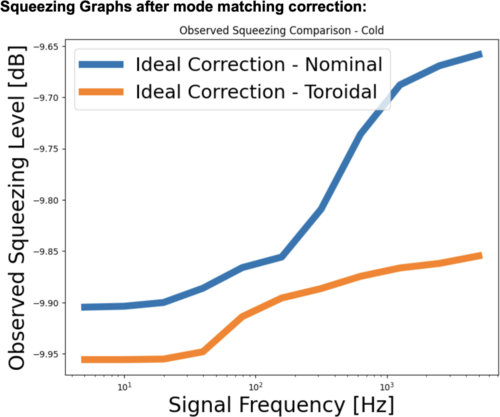
| After some tests, I have determined that the squeezer in the aLIGO katscript is currently being matched to the SRC. This logic will cause issues if the SRC mode is perturbed and no longer closely matched to arm modes. Currently, my modification to the code involves taking the arm mode incident at the ITM and propagate the beam parameter using the ABCD matrix from the ITM to the injected squeezing port. Rerunning some of the squeezing simulations for a cold interferometer, it appears the toroidal case remains the same but the nominal mirror case degrades. Is this expected when we match to the arm instead of the SRC? |
| Attachment 1: screenshot2.png
|
|
| Attachment 2: screenshot1.png
|
|
|
621
|
Tue Aug 5 11:25:17 2025 |
Mary | Update | | point absorber and coated aperture in A# |
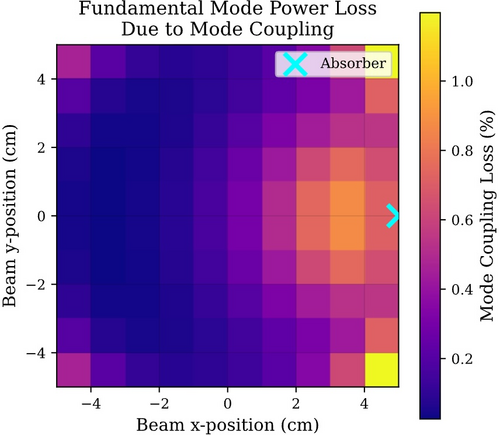
Simulating how point absorber defects on Advanced LIGO mirrors affect cavity performance by modeling a 4km LIGO-like arm cavity with a point absorber fixed at 5cm off-center on the ITM. In this simulation, displaced the laser beam across a 21×21 grid while calculating the deformation, then measuring the resulting power loss in the cavity (~283W circulating power). |
| Attachment 1: point_absorber_A#.pdf
|

|
|
630
|
Tue Aug 12 13:49:24 2025 |
Mary | Update | | point absorber and coated aperture in A# |
|
| Attachment 1: Aug12.pdf
|

|
|
660
|
Thu Nov 13 12:39:01 2025 |
Mary | Update | Interferometer Simulations | |
|
| Attachment 1: PA.pdf
|

|
|
671
|
Thu Jan 22 13:12:29 2026 |
Mary | Update | | |
|
| Attachment 1: PA_matem2.pdf
|

|
| Attachment 2: PA_maxtem6.pdf
|

|
| Attachment 3: maxtem600.jpg
|
|
| Attachment 4: maxtem2dis.jpg
|
|
| Attachment 5: dismaxtem6.jpg
|
|
|
681
|
Thu Feb 5 13:59:42 2026 |
Mary | Update | Interferometer Simulations | |
|
| Attachment 1: 112.pdf
|

|
|
684
|
Thu Feb 12 12:59:29 2026 |
Mary | Update | | |
|
| Attachment 1: SB_scattering.pdf
|

|
|
606
|
Tue Jul 8 11:46:55 2025 |
Maple Matzner | Update | TCS | Update on SURF progress for Jul 8 |
|
| Attachment 1: Maple_TCS_update_jul_8.pdf
|

|
|
617
|
Tue Jul 29 11:45:19 2025 |
Maple | Update | TCS | Meeting update |
|
| Attachment 1: Maple_TCS_update_jul_29.pdf
|

|
|
541
|
Sun Mar 23 15:39:06 2025 |
Luke Johnson | Update | Scripts/Programs | Ringheater Location optimization |
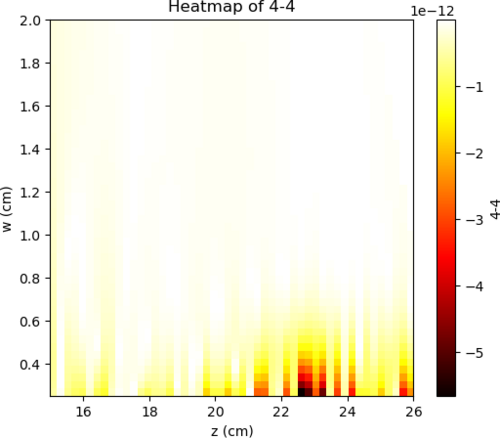
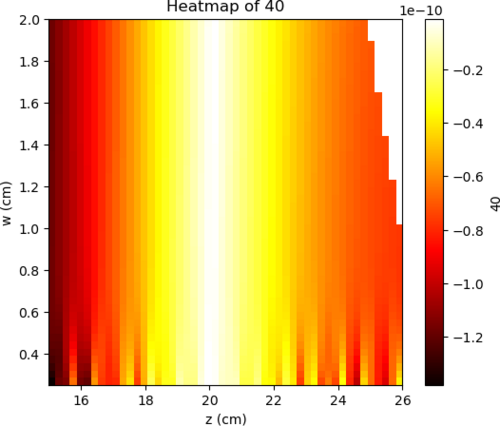
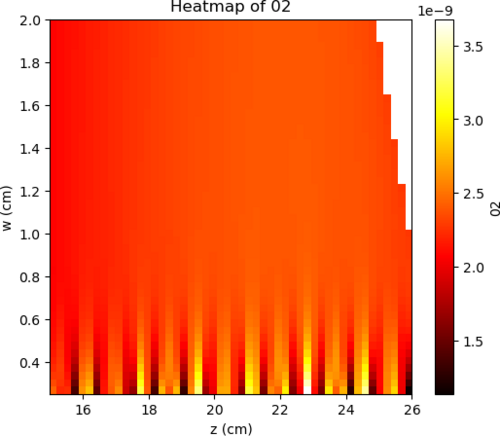
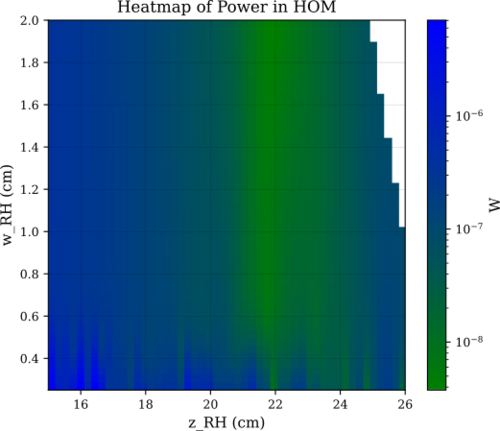
| Attached are some plots that show a new parameter sweep with a finer mesh then before. I have also been able to get a heatmap of power of HOMs in a very simple finesse model. |
| Attachment 1: _4-4.png
|
|
| Attachment 2: _40.png
|
|
| Attachment 3: 02.png
|
|
| Attachment 4: HOM_power.svg
|
|
|
543
|
Mon Mar 31 11:26:45 2025 |
Luke Johnson | Update | Scripts/Programs | Heatmaps of power delivery performance |
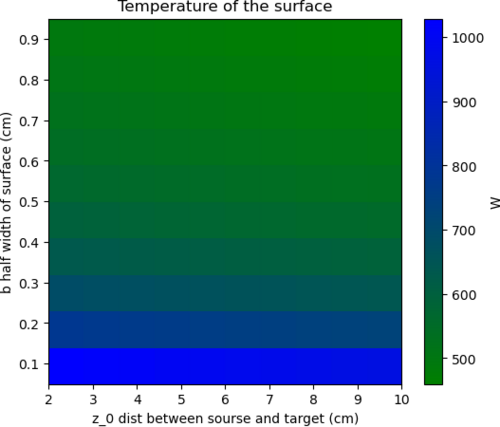
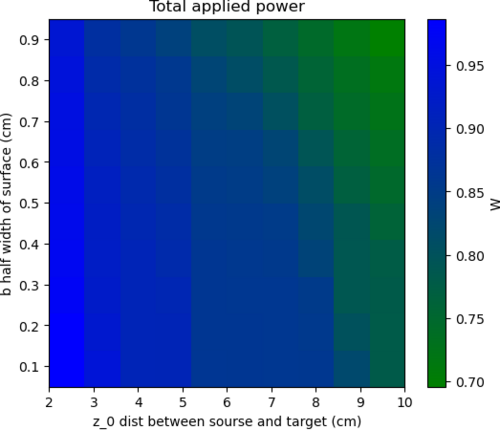
| These plots show the required temperature to release 100W of power and the efficiency of a particular configuration with half-width w and distance away from the barrel z. I want to add to these heat maps a limit line that has restricts the proximity of the reflectors from the barrel. |
| Attachment 1: temp_required.png
|
|
| Attachment 2: efficiency.png
|
|
|
405
|
Mon Jul 15 13:30:49 2024 |
Luke | Update | VAC | Problem with 2.75" to 1.33" zero length reducer |
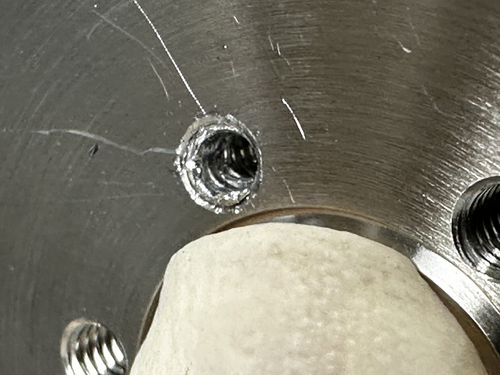
| Last Friday while checking the depth of the ZLR I got one of the screws stuck. Today I tried a couple things to get it out. First I tried a few different pliers to be able to grip lower on the screw this didn't work. So I switched to the other method of drilling a small hole to see if maybe the threads would pull away from the walls of the hole a bit. This kind of worked as seen in the picture below I was able to remove most of the screw but there is a bit still stuck which I was not able to remove and I didn't want to use a larger bit for fear of damaging the tapped hole. |
| Attachment 1: IMG_1882.jpg
|
|
|
423
|
Mon Aug 12 16:35:30 2024 |
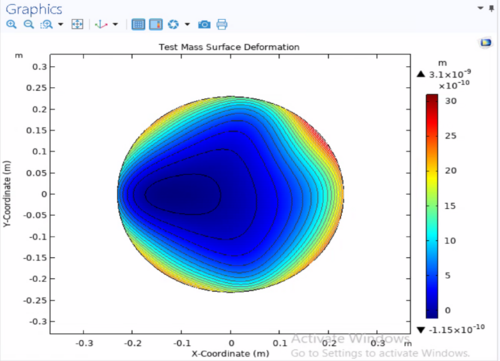
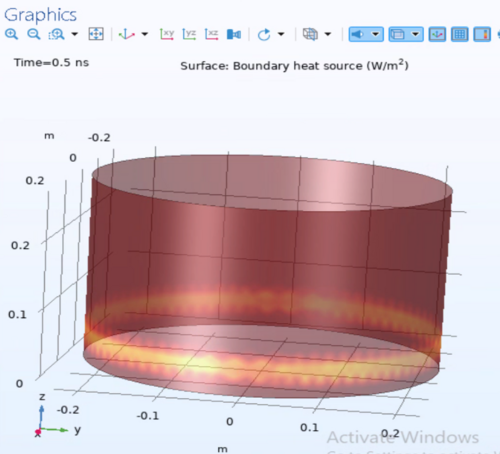
Luke | Update | | Ringheater modeling Update |
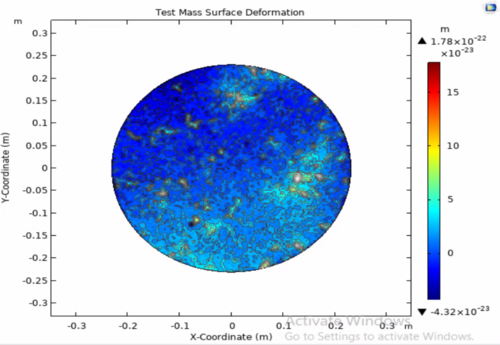
|
| Attachment 1: HR_surface_deformation.png
|
|
| Attachment 2: Irradiation_pattern_input.png
|
|
| Attachment 3: HR_surface_deformation_other.png
|
|
|
435
|
Fri Sep 6 14:34:52 2024 |
Luke | Update | VAC | Heating tape work |
On the 5th I had tried to start baking the vacuum chamber however certain parts of the chamber were getting too hot and causing the controllers to shut off. So I turned them off so that the next day I could rearrange the temperature probes. I then on the 6th set them up so that instead of overshooting the temperature they would be a little low in places.
After being left over night the cooler parts of the vacuum chamber got much closer to the desired temperature of 120C.
Here is a table of the temperatures of the sections of the chamber. Note: After these measurements were taken the PID controllers were set to 125C.
| Location |
Temperature (C) |
| Lid (PID controller 1 emergency shutoff) |
108 |
| Barrel lower (PID controller 1) |
120 |
| Barrel upper (PID controller 2 emergency shutoff) |
118 |
| RGA volume (PID controller 2) |
120 |
Here is a table of temperature of the flanges that have electronics.
| Electronics |
Temperature (C) |
| Pressure gauge (Main volume) |
79 |
| Main turbo pump |
64 |
| RGA |
51 |
| Pressure gauge (RGA volume) |
55 |
| Cal leak |
47 |
| Mini turbo pump |
50 |
| Pirani gauge |
45 |
Other temperatures of note:
The optical table was about 38C
The cleanroom was around 33C (~91F) |
|
452
|
Wed Oct 2 12:05:42 2024 |
Luke | Update | | Ringheater modeling Update |
Power point slides |
|
Draft
|
Wed Oct 23 12:33:54 2024 |
Luke | Update | | Zernike calculation update |
PowerPoint slides new
PowerPoint slides older |
|
471
|
Wed Nov 13 14:06:00 2024 |
Luke | Update | General | |
slides |
|
472
|
Thu Nov 14 10:46:20 2024 |
Luke | Summary | Cleanroom | Cleanroom cleaning |
[Luke, Luis, Michael]
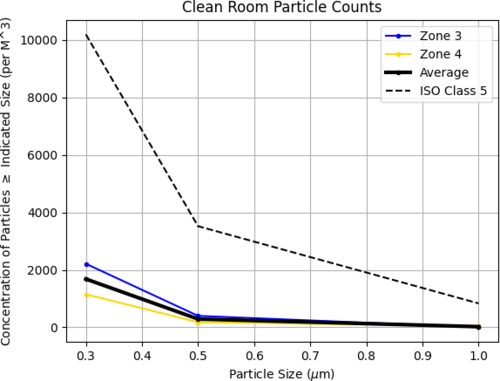
cleaning cleanroom and particle count
- 8:30 am: started particle count
- zone 3:
- 0.3 u: 1195
- 0.5 u: 177
- 1.0 u: 132
- zone 4:
- 0.3 u: 619
- 0.5 u: 0
- 1.0 u: 0
- 9:00 am: began surface check and wipedown, including softwalls
- 9:35 am: started vacuuming the floor
- 9:43 am: finished vacuuming the floor
- 9:45 am: started mopping the floor
- 9:55 am: finished mopping the floor
- 9:56 am: started cleaning the buckets
- 10:00 am: started mopping with IPA wipes
- 10:05 am: finished mopping with IPA wipes
- 10:20m: started particle count
- zone 3:
- 0.3 u: 2213
- 0.5 u: 398
- 1.0 u: 0
- zone 4:
- 0.3 u: 1150
- 0.5 u: 177
- 1.0 u: 44
|
| Attachment 1: partical_count_final.png
|
|
|
474
|
Tue Nov 19 17:10:34 2024 |
Luke | Update | VAC | Leak check |
Chamber temperature: 23C
Chamber Initial Pressure: ~1.8e-8 main, ~3.5e-8 rga
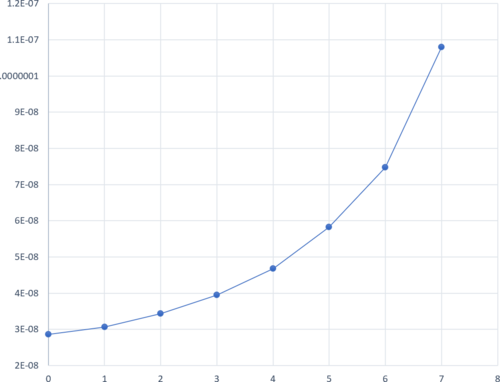
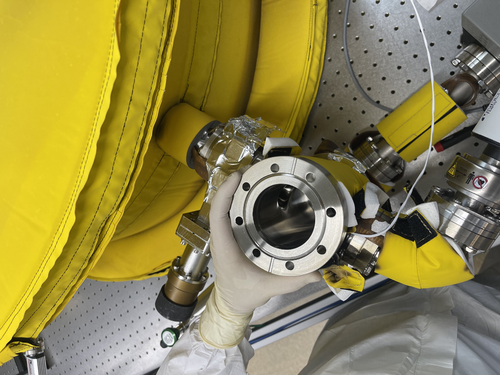
Did another leak test after monday's work to check how the seal was holding up initial leak was 5.5e-9. I then tried to tighten the bolts a bit more the leak rose to 1.9e-8 about a factor of 4 change.
I checked another flange to confirm that I was preforming the test properly. I measured the elbow to pressure sensor to be 2.2e-11 aproximatly what it was earlier in the month (1.9e-11).
I ran another isolation test. It is still exponetial. Graph attached.
Thoughts:
I belive at this point that it is a knife edge issue when replacing the gasket I checked both flanges and the new gasket. The tp knife edge seemed perfectly fine, the gasket had very minor scratches, and the reducing cross had very small imperfections on its edge.
We may want to try and use the liquid sealant or get annealed gaskets for 4.5" |
| Attachment 1: image.png
|
|
| Attachment 2: IMG_5116.jpeg
|
|
| Attachment 3: IMG_5117.jpeg
|
|
|
478
|
Wed Nov 27 12:27:45 2024 |
Luke | Summary | VAC | Summary of vacuum work |
[Luke, Luis]
Update of current state of vacuum chamber
Current temp: 24°C
Current pressure: Main 1.77e-8, RGA 5.3e-9 [torr] (Gate valve open)
Summary of recent work-->
To try and reduce the leak in the turbo pump by reducing cross-connection, we replaced the copper gasket. This made no improvement to the leaks.
Initially: 1.9e-9 --->
Left side: 1.33e-9, Right side: 3.37e-9 (Gate valve open)
This is still a significant leak. We have tried to tighten the bolts further, but they are as tight as reasonably possible.
Things of note: While examining the knife edges, we found some very slight imperfections on the reducing cross's flange as seen in 474. This could be the source of our leak. We have replaced this gasket 1-2 times already and consistently have a slight leak. This imperfection is on the right side of the flange, which would be consistent with the measurements above.
Unless we want to use the liquid sealant or replace the gasket with an annealed gasket, we could try baking the system again, as this allowed us to reach UHV in the main volume before. It also allowed us to pass the RGA scan, which we are currently failing. (see attached) |
| Attachment 1: 2024-11-27_PostBake1_ArO.png
|

|
|
480
|
Wed Nov 27 16:23:58 2024 |
Luke | Update | VAC | Started bake |
[Luke, Luis]
The vacuum chamber is currently baking.
We stepped up to 125°C by increments of 30°C starting at 60°C. Everything went fine. After about 20 minutes of the PID controllers being set to 125°C, the flange closest to the RGA was 38°C, so we left it connected.
Current state as of 4:15:
The gate valve is open, and the filament of the RGA is on.
The temperatures are as follows:
PID right barrel upper: 105°C, RGA volume: 125°C
PID left barrel lower: 125°C, Lid: 82°C
The lower temperatures should climb as the whole system heats up.
I will come in Saturday afternoon to turn them off so that we can look at the pressures on Monday. |
|
483
|
Mon Dec 2 13:35:45 2024 |
Luke | Update | General | Clean and bake of Viton O-rings |
[Luke, Luis]
We couldn't access the bake log on the wiki. (see attached) So we looked in the documentation provided on the DCC to find at what temperature to bake the Viton O-rings. We found that we should bake Viton at 180°C for 24 hours.
So we sonic-washed the O-rings, dried them, and then put them in the oven set to the following:
100°C in 15 minutes
100°C for 30 minutes
180°C in 30 minutes
180°C for 24 hours
30°C in 2 hours
Other things of note:
We refilled the water container as it was running out.
The nitrogen used to dry the clean and baked objects is now critically low.
The helium used in leak testing is also quite low (~400 psi).
Regarding the vacuum chamber:
I reattached the pressure gauges to the chamber and gave them about an hour to stabilize. They read out main 8.7e-9, RGA 2.6e-9. Please note these pressures should lower more as we only stopped baking on Saturday afternoon. |
| Attachment 1: image_(2).png
|
.png.png)
|
|
497
|
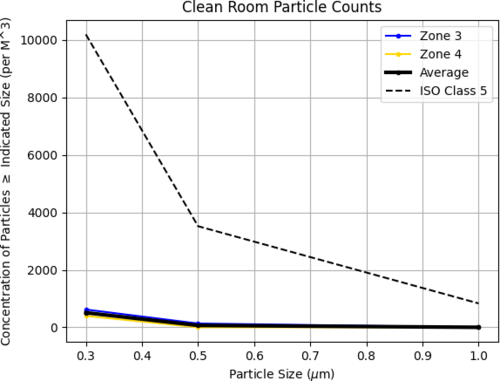
Wed Jan 8 17:35:57 2025 |
Luke | Summary | Cleanroom | Cleanroom cleaning |
[Luke, Tyler, Cynthia, Shane, Michael]
Summary of Cleaning Activities:
We began cleaning Room 1119 at 2:00 PM.
At 2:30 PM, we moved to Room 1129 and continued cleaning.
Cleaning tasks included wiping down dust-collecting surfaces and vacuuming the floors.
Once the labs were clean, we proceeded to the cleanroom.
- Wiping down surfaces and soft walls
- Vacuuming, mopping the floor, and finishing with IPA wipes
Particle Count Measurements:
- Pre-cleaning (2:30 PM):
- Zone 3:
- 0.3 µm: 973
- 0.5 µm: 354
- 1.0 µm: 132
- Zone 4:
- 0.3 µm: 486
- 0.5 µm: 177
- 1.0 µm: 0
- Post-cleaning (4:10 PM):
- Zone 3:
- 0.3 µm: 619
- 0.5 µm: 132
- 1.0 µm: 0
- Zone 4:
- 0.3 µm: 397
- 0.5 µm: 0
- 1.0 µm: 0
|
| Attachment 1: partical_count_250108.png
|
|
|
500
|
Tue Jan 21 10:12:02 2025 |
Luke | Summary | General | Frosti toy model |
[Luke, Liu]
Over the winter break I have been working on this desmos toy model of the Frosti. There are still a few rough spots but I belive that it is a good visual representation of a 2D slice of the frosti. |
|
502
|
Sat Jan 25 18:19:39 2025 |
Luke | Update | General | Ringheater modeling Update |
Here is a quick update on some of the things I have been working on regarding my project. |
|
507
|
Sat Feb 1 17:25:52 2025 |
Luke | Summary | General | Cleanroom cleaning |
[Luke, Cece, Luis]
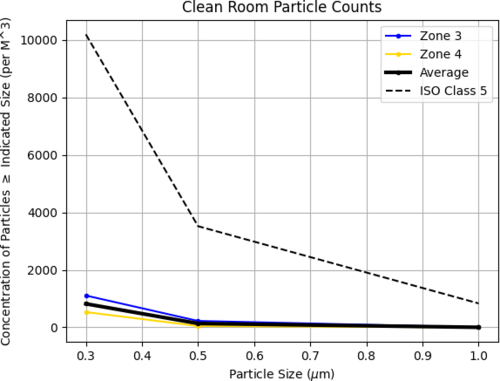
Particle Count Measurements:
- Pre-cleaning (12:15 PM):
- Zone 3:
- 0.3 µm: 1325
- 0.5 µm: 265
- 1.0 µm: 0
- Zone 4:
- 0.3 µm: 618
- 0.5 µm: 132
- 1.0 µm: 44
- Started Cleaning (3:20 pm)
- Finished Cleaning (4:20 pm)
- Post-cleaning (4:35 PM):
- Zone 3:
- 0.3 µm: 1106
- 0.5 µm: 221
- 1.0 µm: 0
- Zone 4:
- 0.3 µm: 530
- 0.5 µm: 44
- 1.0 µm: 0
|
| Attachment 1: 20250131_particalcount.png
|
|