| ID |
Date |
Author |
Type |
Category |
Subject |
|
685
|
Thu Feb 12 13:50:38 2026 |
Xuesi Ma | Update | VAC | Vacuum status warning system |
Vacuum Pressure Warning Script
Script Location: controls@chimay
Script Path: /vac/python/serial/temp_vacuum_warning.py
Purpose
Implement an automated warning system that monitors vacuum pressure and sends
email alerts when pressure thresholds are exceeded.
Implementation Details
-
The script runs
launcher.py (located in the same directory)
every 30 minutes to retrieve the latest vacuum pressure reading.
-
If the pressure rises above the critical threshold
(≥ 1 × 10⁻⁶ Torr), an email alert will be sent
to all group members.
-
If the pressure rises above the warning threshold
(≥ 1 × 10⁻⁷ Torr), an email alert will be sent
to Xuesi Ma.
-
If
launcher.py fails to retrieve the vacuum pressure,
or if any execution error occurs, an error notification email
will be sent to Xuesi Ma.
How to Run
python temp_vacuum_warning.py
Note
An app password is required for authentication in order to send alert emails.
|
|
684
|
Thu Feb 12 12:59:29 2026 |
Mary | Update | | |
|
| Attachment 1: SB_scattering.pdf
|

|
|
683
|
Thu Feb 12 12:53:51 2026 |
Cece Ochoa | Update | ELOG | CE Cavity Design Update |
| Update on HOM placement w/ cavity locking. Still verifying mode placement
RoC: 28340m and 26874m |
| Attachment 1: 2_12_short_update.pdf
|

|
|
682
|
Thu Feb 12 12:25:38 2026 |
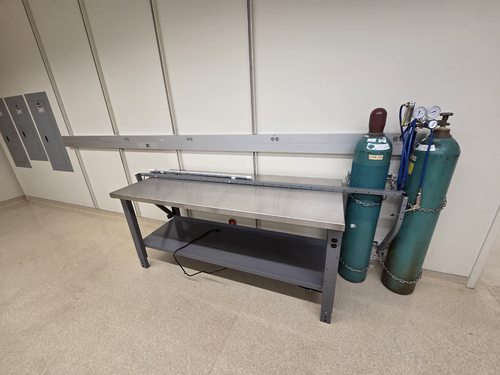
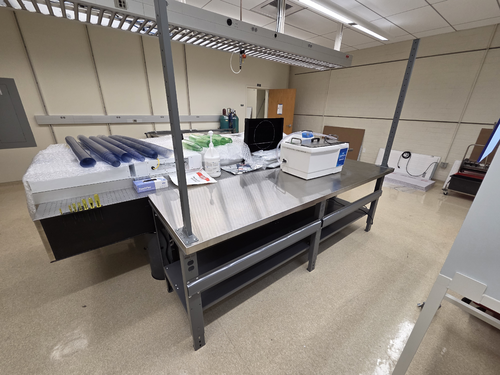
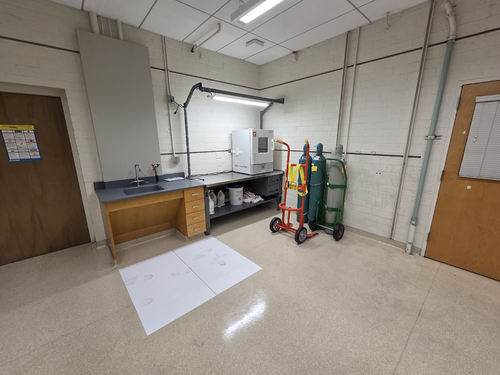
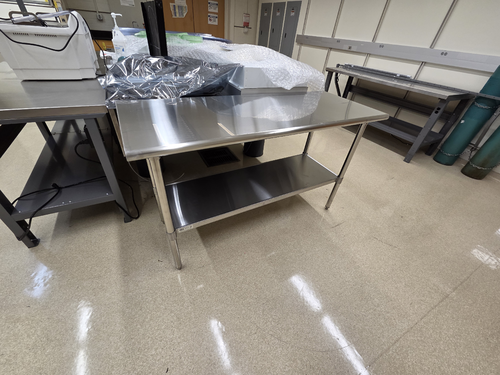
Xuesi Ma | Infrastructure | General | Lab floor plans |
[Cece, Ma, Mary, Pooyan, Tyler, Paul]
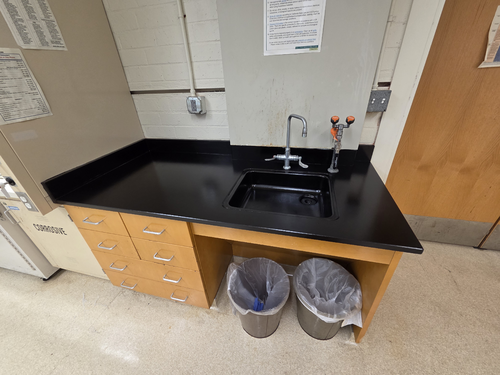
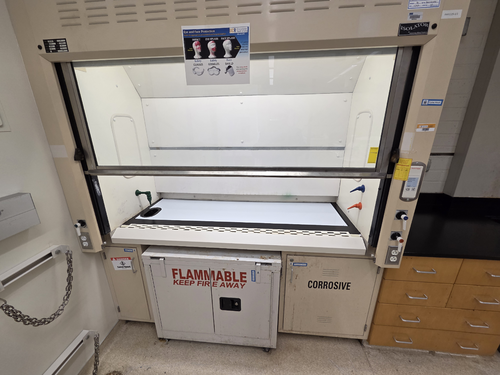
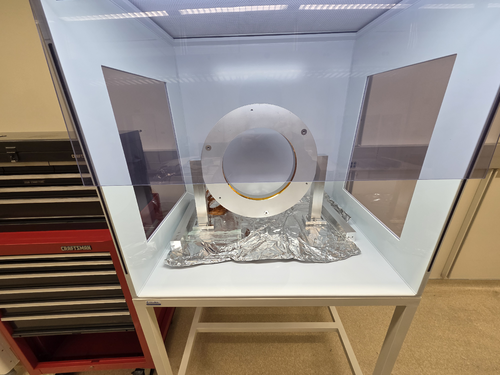
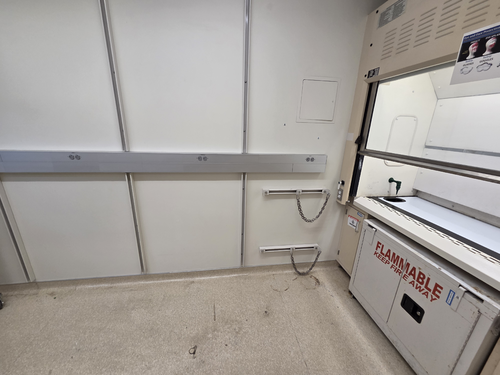
We have continued the reorganization of our Physics 1125 and 1129 lab spaces. This includes:
- Moving two workbenches from Room 1129 into Room 1125
- The workbench with the oven is still in Room 1129
- Assembling the stainless steel table
- Moving the cleanroom frame toward the whiteboard side to make room for HVAC work
The sink in Room 1125 was painted, and we stood Frosti up. |
| Attachment 1: 2563.jpg
|
|
| Attachment 2: 2567.jpg
|
|
| Attachment 3: 2570.jpg
|
|
| Attachment 4: 2569.jpg
|
|
| Attachment 5: 2564.jpg
|
|
| Attachment 6: 2565.jpg
|
|
| Attachment 7: 2568.jpg
|
|
| Attachment 8: 2566.jpg
|
|
|
681
|
Thu Feb 5 13:59:42 2026 |
Mary | Update | Interferometer Simulations | |
|
| Attachment 1: 112.pdf
|

|
|
680
|
Thu Feb 5 13:49:31 2026 |
Michael | Update | Interferometer Simulations | Updating Squeezing Mode Matching Logic |
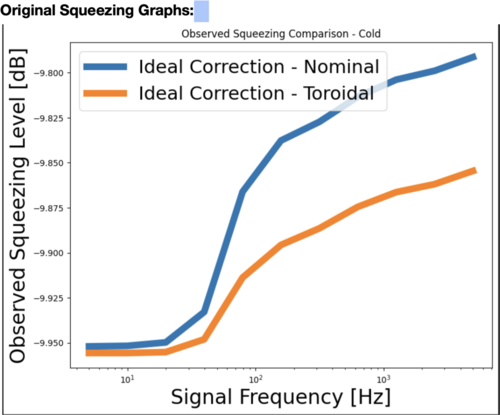
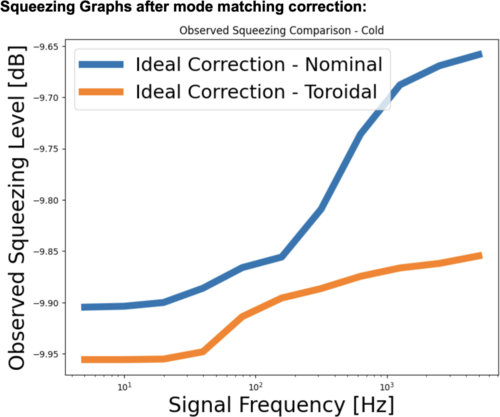
| After some tests, I have determined that the squeezer in the aLIGO katscript is currently being matched to the SRC. This logic will cause issues if the SRC mode is perturbed and no longer closely matched to arm modes. Currently, my modification to the code involves taking the arm mode incident at the ITM and propagate the beam parameter using the ABCD matrix from the ITM to the injected squeezing port. Rerunning some of the squeezing simulations for a cold interferometer, it appears the toroidal case remains the same but the nominal mirror case degrades. Is this expected when we match to the arm instead of the SRC? |
| Attachment 1: screenshot2.png
|
|
| Attachment 2: screenshot1.png
|
|
|
679
|
Thu Feb 5 13:34:13 2026 |
Cynthia | Update | Interferometer Simulations | Point absorber + miscentering simulation |
|
| Attachment 1: update2_5_(3).pdf
|
.png)
|
|
678
|
Thu Feb 5 13:12:28 2026 |
Tyler | Update | TCS | A# FROSTI Profiles 01/15/26 |
Slides updating progress on FROSTI A# irradiance profiles and reflector design. Edge roll-off is now included for thermoelastic deformation corrections.
| Quote: |
A# Profile optimization update for 01/28/2026 group meeting.
Slides |
|
|
676
|
Thu Feb 5 11:42:47 2026 |
Jon | Infrastructure | General | Lab floor plans |
[Audrey, Cece, Jon, Ma, Mary, Michael, Pooyan, Tyler, Shane]
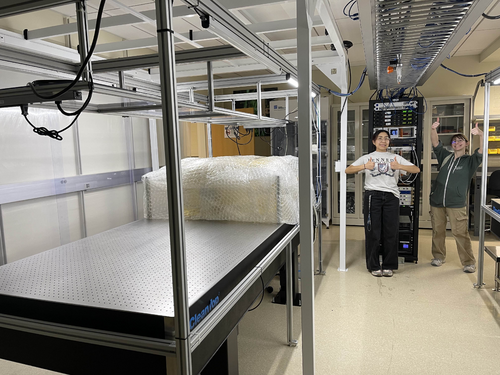
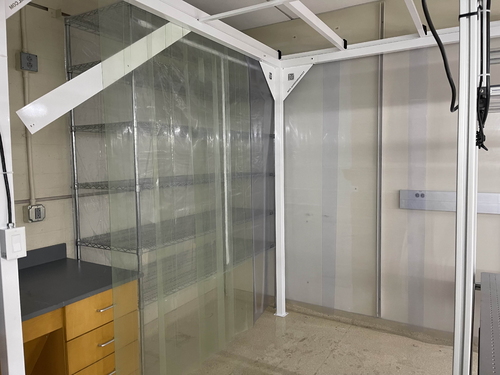
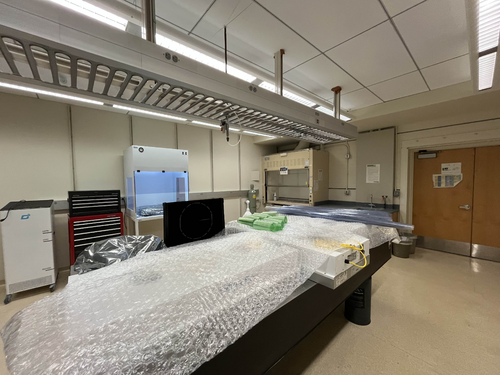
We have completed the preliminary reorganization of our Physics 1119 lab space. This includes:
- Moving all cabinets to their final positions
- Clearing out all equipment from the cleanroom in prep for HVAC work, and storing them in either the HEPA cabinet or double-bagging in regular storage.
- Moving all non-essential equipment into other lab spaces.
- Wrapping vacuum system and VLC for protection
- Removing all ceiling tiles and fans from the ceiling of the cleanroom
- Moving the cleanroom frame towards the front of the room.
Prepping the new clean-and-bake station in 1125 will begin within the next week, along with the construction of the stainless steel table planned to be put into the cleanroom.
| Quote: |
| Attached are the starting and final floor plans for the February 2026 expansion into the Physics 1125 lab. |
|
| Attachment 1: image.jpg
|
|
| Attachment 2: image_1.jpg
|
|
| Attachment 3: image_3.jpg
|
|
|
675
|
Thu Jan 29 12:46:22 2026 |
Cece Ochoa | Update | | CE Cavity Design Update (4) |
| Update for CE Cavity Arms + Modes
https://docs.google.com/presentation/d/1-dXYylkAbNpHR4WVCx9Q8ryL_xGlH-JSSLXEUQg6b7Q/edit?usp=sharing |
|
674
|
Wed Jan 28 11:29:30 2026 |
Tyler | Update | TCS | A# FROSTI Profiles 01/15/26 |
A# Profile optimization update for 01/28/2026 group meeting.
Slides |
|
673
|
Thu Jan 22 14:06:00 2026 |
Xuesi Ma | Update | TCS | FROSTI A# Reflector Update |
| Slides |
|
672
|
Thu Jan 22 13:18:12 2026 |
Pooyan | Infrastructure | General | Lab floor plans |
The working document of tasks regarding moving the clean room is attached. Needs LIGO account to access and edit.
https://docs.google.com/document/d/14HhMYBcHmM62Hc1YJhinMsG5uPx6xoW0WEBmDcbNMMg/edit?usp=sharing
|
|
671
|
Thu Jan 22 13:12:29 2026 |
Mary | Update | | |
|
| Attachment 1: PA_matem2.pdf
|

|
| Attachment 2: PA_maxtem6.pdf
|

|
| Attachment 3: maxtem600.jpg
|
|
| Attachment 4: maxtem2dis.jpg
|
|
| Attachment 5: dismaxtem6.jpg
|
|
|
670
|
Thu Jan 22 10:10:31 2026 |
Jon | Infrastructure | General | Lab floor plans |
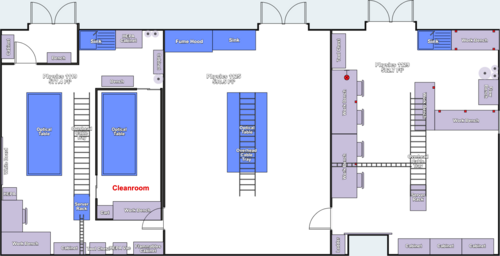
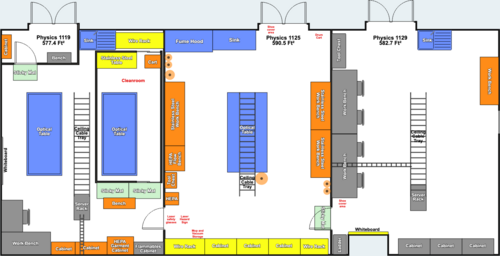
| Attached are the starting and final floor plans for the February 2026 expansion into the Physics 1125 lab. |
| Attachment 1: Pre-Feb-2026.png
|
|
| Attachment 2: Post-Feb-2026.png
|
|
|
669
|
Thu Jan 15 13:52:55 2026 |
Xuesi Ma | Update | TCS | FROSTI A# Reflector Update |
| Slides |
|
668
|
Thu Jan 15 12:52:58 2026 |
Tyler | Update | TCS | A# FROSTI Profiles 01/15/26 |
| Slides |
|
667
|
Thu Jan 8 12:51:03 2026 |
Tyler | Update | TCS | FROSTI A# Update 01/08/2026 |
| Slides |
|
666
|
Thu Dec 18 12:51:13 2025 |
Tyler | Update | TCS | FROSTI A# Profiles Update |
| Slides |
|
665
|
Thu Dec 4 12:10:19 2025 |
Tyler | Update | TCS | FROSTI A# Profiles and Element Width Optimization |
| Slides |
|
664
|
Thu Nov 20 13:54:34 2025 |
Tyler | Update | TCS | FROSTI A# Optimization and Mesh Convergence Analysis |
| Attached below are slides discussing FROSTI A# Irradiance optimization and mesh convergence analysis for penetration depth. |
| Attachment 1: Updates_11_19_2025-3.pdf
|

|
|
663
|
Thu Nov 20 13:03:58 2025 |
Cece Ochoa | Update | ELOG | CE Cavity Design Update |
| Update on grouping 0+8th Order Modes |
| Attachment 1: 11_20_update.pdf
|

|
|
662
|
Thu Nov 20 12:40:47 2025 |
Xuesi Ma | Infrastructure | General | Room 1125 Optical Table |
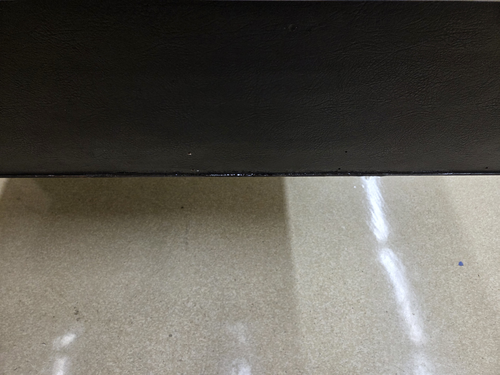
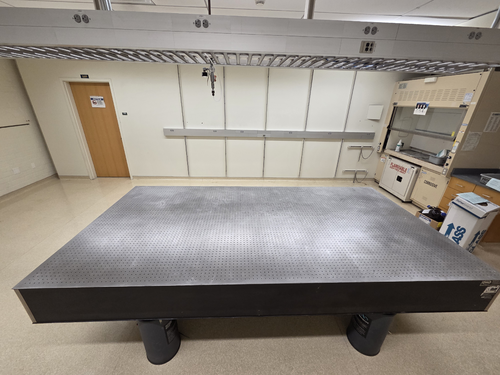
Cleaned off the tapes on the optical table with acetone. |
| Attachment 1: 1651.jpg
|
|
| Attachment 2: 1650.jpg
|
|
|
660
|
Thu Nov 13 12:39:01 2025 |
Mary | Update | Interferometer Simulations | |
|
| Attachment 1: PA.pdf
|

|
|
659
|
Thu Nov 6 12:39:43 2025 |
Cece Ochoa | Update | ELOG | CE Cavity Design Update |
| Updated mode placements and ROC. No thermal effects added yet. |
| Attachment 1: base_0_6_plot.pdf
|

|
| Attachment 2: base_0_7_plot.pdf
|

|
|
658
|
Thu Oct 30 11:45:44 2025 |
Liu | Update | Interferometer Simulations | Multi-ring FROSTI optimization for A# |
| Multi-ring FROSTI optimization for A#: dimensionality reduction with PCA vs. t-SNE |
| Attachment 1: Update.pdf
|

|
|
Draft
|
Thu Oct 23 11:34:05 2025 |
Michael | Update | Interferometer Simulations | Updated Exploration into Different SRC Mirror Configurations for Improved Squeezing |
|
| Attachment 1: Update_Slides_10_23_25.pdf
|

|
| Attachment 2: Update_Slides_10_30_25.pdf
|

|
|
656
|
Thu Oct 23 11:09:16 2025 |
Xuesi Ma | Update | Measuring Noise in Interferometer | Scatter Noise Model |
DetChar meeting presentation |
|
655
|
Thu Oct 23 10:07:51 2025 |
Liu | Update | Interferometer Simulations | Multi-ring FROSTI optimization for A# |
| 4D parameter space visualization and dimensionality reduction for better optimization |
| Attachment 1: loss_embedding.html
|
| Attachment 2: Update.pdf
|

|
|
654
|
Thu Oct 16 10:31:20 2025 |
Liu | Update | Interferometer Simulations | Multi-ring FROSTI optimization for A# |
| Two-ring FROSTI grid search with 4D parameter space search and visualization |
| Attachment 1: interactive_plot_dropdown.html
|
| Attachment 2: Update.pdf
|

|
|
653
|
Fri Oct 10 14:40:23 2025 |
Xuesi Ma | Update | VAC | Pressure gauge Swap |
[Tyler, Ma]
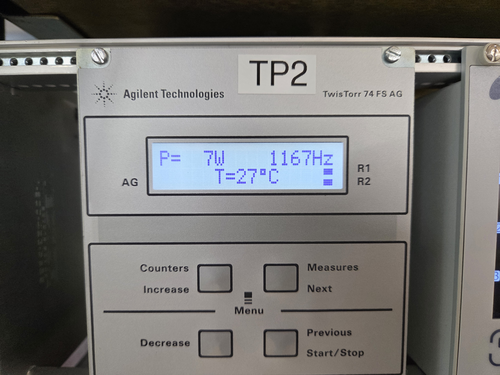
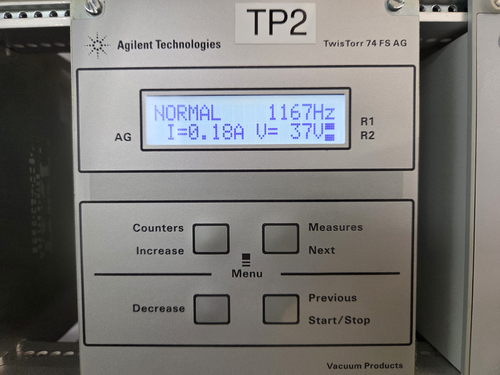
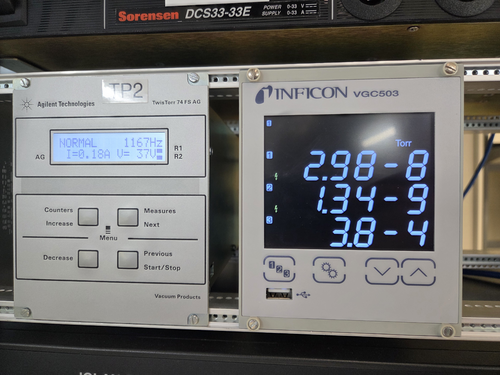
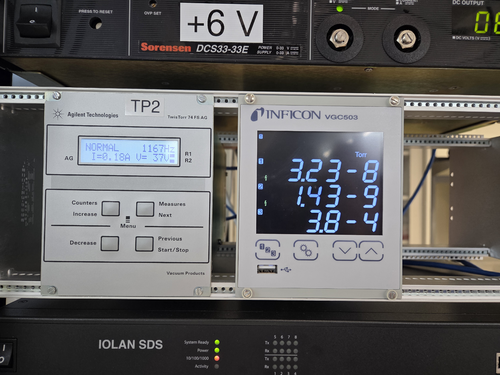
We suspect a pressure gauge problem. The electronic unit of the main chamber pressure gauge and the electronic unit of the RGA chamber pressure gauge are swapped.
Power and current draw aren't high for the turbo pump.
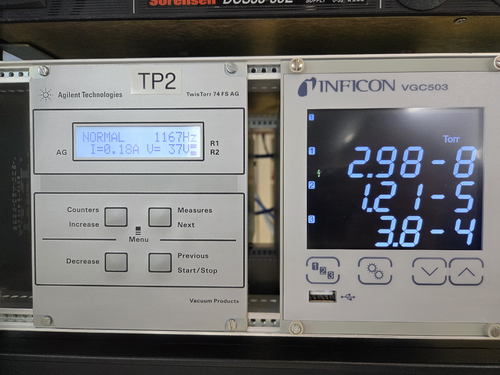
Before opening the gate valve, the pressure in the Main chamber is 2.98e-8 Torr, RGA Chamber 1.21e-5 Torr
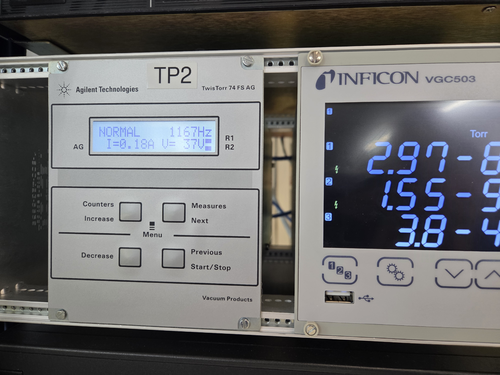
After opening the gate valve (not fully open), the pressure in the Main chamber is 2.97e-8 Torr, RGA Chamber 1.55e-9 Torr. Note: the HV sensor suddenly turned on and the reading jumped to -9 Torr
Opening the gate valve a bit more, the pressure in the Main chamber is 2.98e-8 Torr, RGA Chamber 1.34e-9 Torr.
After switching the electronic unit, the pressure in the Main chamber is 3.23e-8 Torr, RGA Chamber 1.43e-9 Torr.
Gate Valve fully opened at 16:01 Oct 24, 2025 |
| Attachment 1: 1433.jpg
|
|
| Attachment 2: 1434.jpg
|
|
| Attachment 3: 1517.jpg
|
|
| Attachment 4: 1519.jpg
|
|
| Attachment 5: 1520.jpg
|
|
| Attachment 6: 1521.jpg
|
|
|
652
|
Thu Oct 9 12:18:14 2025 |
Liu | Update | Interferometer Simulations | Multi-ring FROSTI optimization for A# |
|
| Attachment 1: Update.pdf
|

|
|
651
|
Wed Oct 8 14:45:12 2025 |
Xuesi Ma | Infrastructure | VAC | RGA Chamber Pressure |
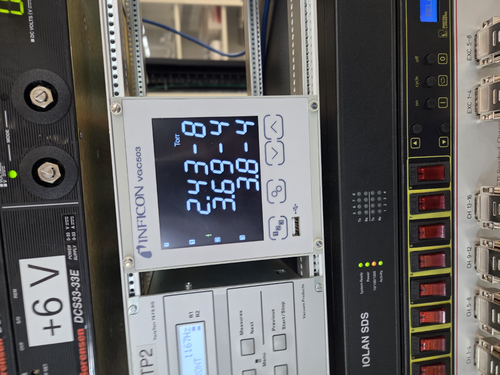
| RGA Chamber pressure is currently at 3.68e-4 torr. |
| Attachment 1: 20251008_130141.jpg
|
|
|
650
|
Tue Sep 30 12:51:23 2025 |
Tyler | Update | TCS | O6 RH Update 09/30/2025 |
| Slides |
|
649
|
Tue Sep 30 12:26:15 2025 |
Liu | Update | Interferometer Simulations | FROSTI optimization for A# |
|
| Attachment 1: Update.pdf
|

|
|
648
|
Tue Sep 23 13:10:07 2025 |
Tyler | Update | TCS | RH O6 Update 09/23/25 |
| Slides |
|
647
|
Tue Sep 23 12:39:29 2025 |
Liu | Update | Interferometer Simulations | Multi-ring FROSTI optimization for A# |
|
| Attachment 1: Update.pdf
|

|
|
646
|
Tue Sep 16 12:47:29 2025 |
Xuesi Ma | Update | Interferometer Simulations | Frosti actuation impact analysis |
| Slides |
|
645
|
Tue Sep 16 12:18:09 2025 |
Liu | Update | Interferometer Simulations | Grid search optimization for single-ring FROSTI |
| Grid search optimization for single-ring FROSTI |
| Attachment 1: Update.pdf
|

|
|
644
|
Tue Sep 9 13:08:44 2025 |
Xuesi Ma | Update | | |
| Slides |
|
643
|
Tue Sep 9 12:13:38 2025 |
Liu | Update | Interferometer Simulations | Multi-ring FROSTI optimization for A# with grid search |
| Multi-ring FROSTI optimization based on IFO metrics for A# with grid search |
| Attachment 1: Update.pdf
|

|
|
642
|
Tue Sep 9 12:06:38 2025 |
Tyler | Update | TCS | RH O6 Update |
| Slides |
|
641
|
Tue Sep 9 12:01:38 2025 |
Tyler, Ma | Update | | |
| Slides |
|
640
|
Tue Sep 2 18:33:38 2025 |
Liu | Infrastructure | General | New lab room 1125 layout and measurement |
Action items for facilities
- Ceiling lights replacement
- Fume hood cleaned and refurbished
- Sink countertop cleaning
- Floor cleaned and waxed
-
|
| Attachment 1: 1125.pdf
|

|
|
639
|
Tue Sep 2 12:41:33 2025 |
Liu | Update | Interferometer Simulations | Multi-ring FROSTI design for A# with ring heater optimization |
| [Tyler, Liu]
Ring heater optimization, continued |
| Attachment 1: Update.pdf
|

|
|
638
|
Tue Sep 2 12:34:02 2025 |
Xuesi Ma | Update | | Updata for self heating effect on HOM |
| https://docs.google.com/presentation/d/19I1fx5BLEzYb4Qnc9P4rJnYAvWI8NqE2dsj9gSPyYzg/edit?usp=sharing |
|
637
|
Tue Sep 2 11:53:34 2025 |
Tyler | Update | TCS | RIN Infrastructure Update (09/02/2025) |
| [Ma, Tyler]
Below are slides discussing RIN infrastructural updates related to the CyMAC.
Slides
|
|
636
|
Tue Aug 26 13:09:03 2025 |
Tyler | Update | TCS | O6 RH Update |
| [Tyler]
Below are slides giving an update on RH O6 design progress.
Slides |
|
635
|
Tue Aug 26 12:45:41 2025 |
Christina, Ma, Tyler | Update | CDS | RIN Update |
| Slides |
|
634
|
Tue Aug 26 12:18:36 2025 |
Michael | Update | Interferometer Simulations | Squeezing Plots for SRC Parameter Space |
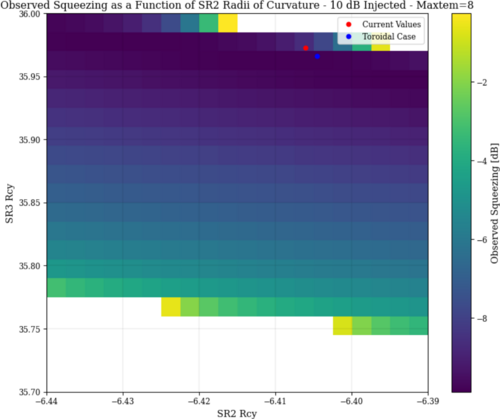
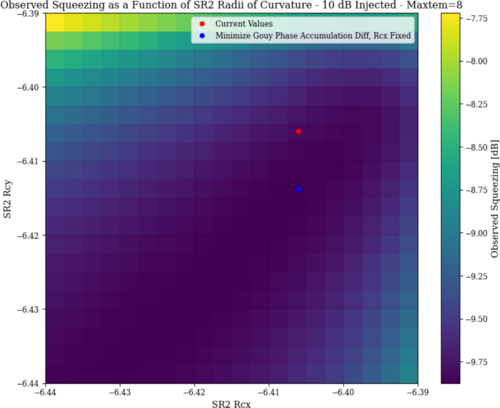
| I've run a few plots of observed squeezing in the LIGO interferometer to fully ensure that the point we have selected is the optimal point for squeezing. Contrary to what I expected, there seems to be much more degenerate "optimal" configurations. While the toroidal case may be near optimal, it seems that the solution we found for a non astigmatic beam is not the only one. I will further explore this space to find more optimal/tolerant positions, which I see evidence of.
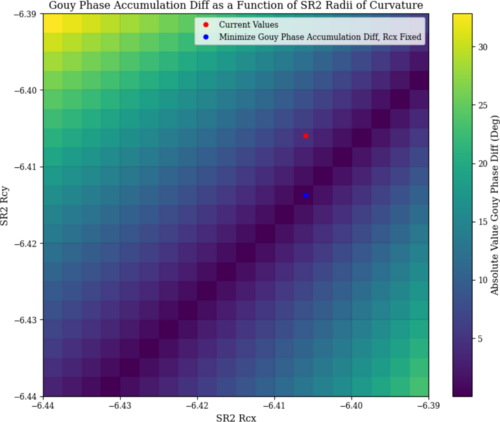
Additionally, as observed squeezing is computational expensive to compute, I found that the difference in round-trip gouy phase accumulation between the x and y planes is a good approximation for an optimal squeezing state, which I believe makes physical sense. This may be helpful to quickly compute other optimal conditions. |
| Attachment 1: Screenshot_2025-08-26_at_12-16-01_LIGO_Project_Log_-_Google_Docs.png
|
|
| Attachment 2: Screenshot_2025-08-26_at_12-16-32_LIGO_Project_Log_-_Google_Docs.png
|
|
| Attachment 3: Screenshot_2025-08-26_at_12-17-26_LIGO_Project_Log_-_Google_Docs.png
|
|