| ID |
Date |
Author |
Type |
Category |
Subject |
|
275
|
Tue Nov 21 22:09:44 2023 |
Aiden | Update | General | Testing Parts |
| [Aiden, Luis]
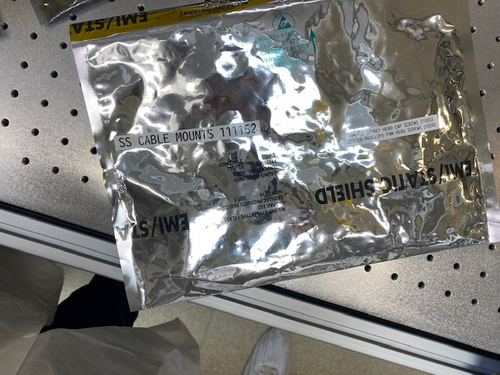
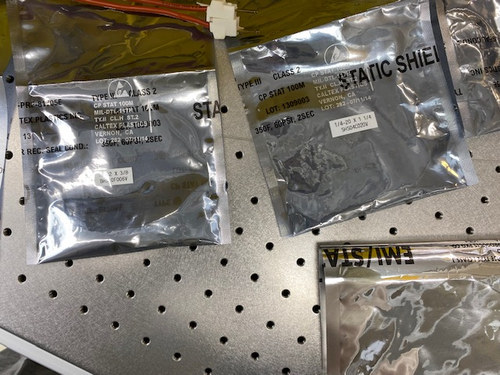
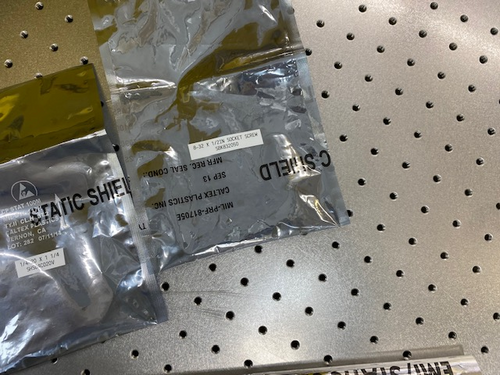
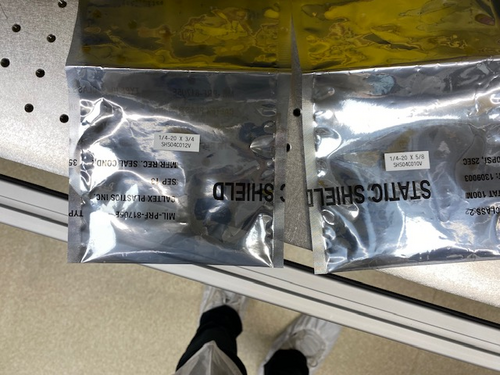
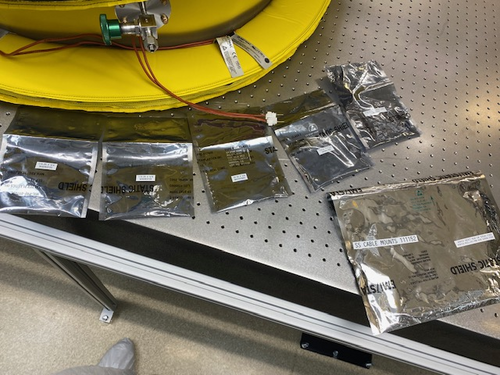
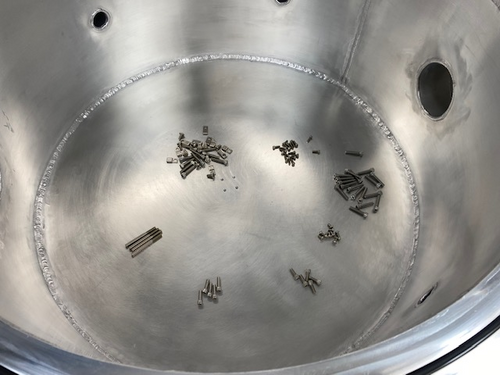
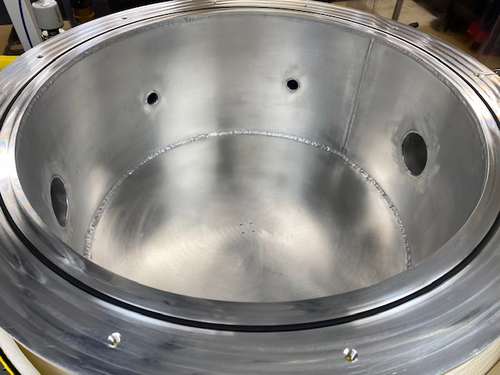
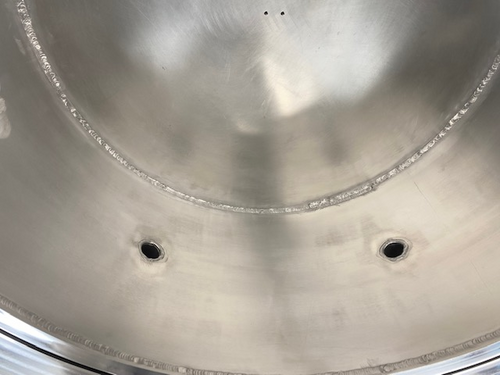
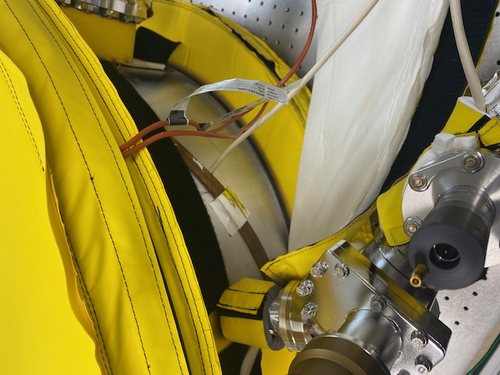
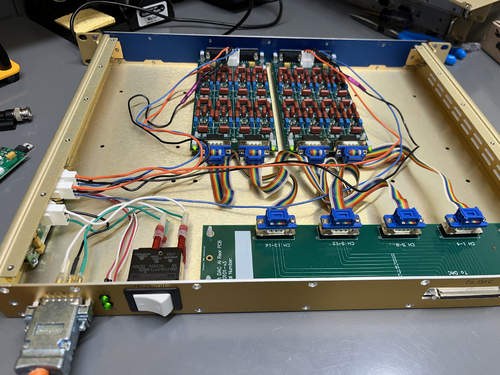
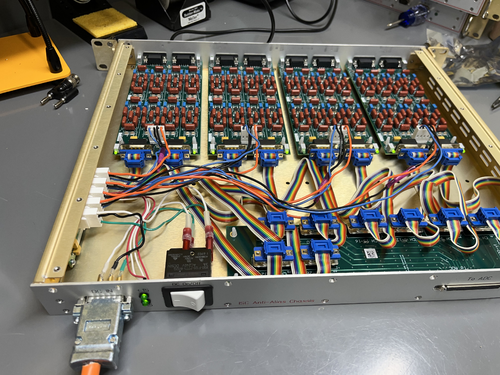
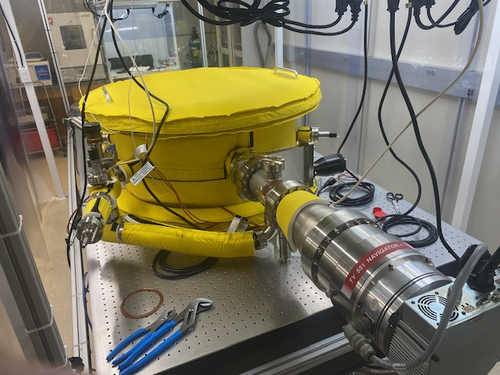
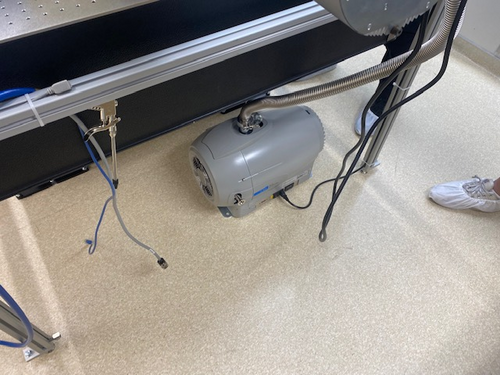
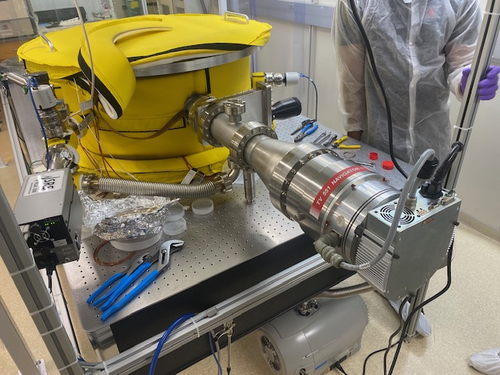
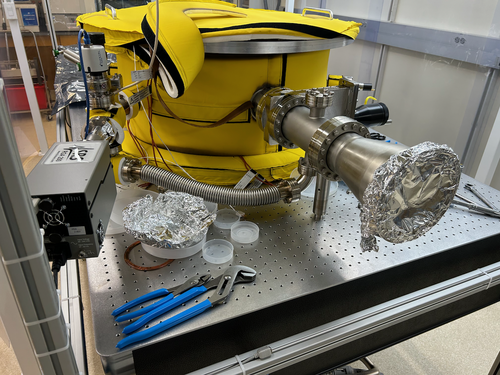
Luis and Aiden vented the chamber today. We closed off the RGA section and then proceeded to open the the vent on the main body after turning off the turbo and backing pump. We then opened the lid and placed in all the stainless steel hardware that will be used in evaluating the FROSTI optics and heater elements. We also inspected the weldments before closing it up. Check the clean and bake data base where there is now a new section outlining the parts in each test. We then closed the lid, tightened the bolts, turned the backing pump back on and let the pressure drop until it was below 1e-1 torr. Then turned the turbo pump back on and after a few hours the pressure was back down to 4.16e-7 torr. The RGA was turned off during all of this and was turned back on when done even though we closed both valves to keep the RGA volume under vacuum. |
| Attachment 1: IMG_4817.jpg
|
|
| Attachment 2: IMG_4815.jpg
|
|
| Attachment 3: IMG_4816.jpg
|
|
| Attachment 4: IMG_4814.jpg
|
|
| Attachment 5: IMG_4813.jpg
|
|
| Attachment 6: IMG_4812.jpg
|
|
| Attachment 7: IMG_4810.jpg
|
|
| Attachment 8: IMG_4811.jpg
|
|
|
274
|
Tue Nov 21 14:47:24 2023 |
Tyler | Update | Lore | 1129 Workbench Assembly Update 1 |
[Tyler, Shane, Mohak, Cynthia, Luke, Michael, Luis]
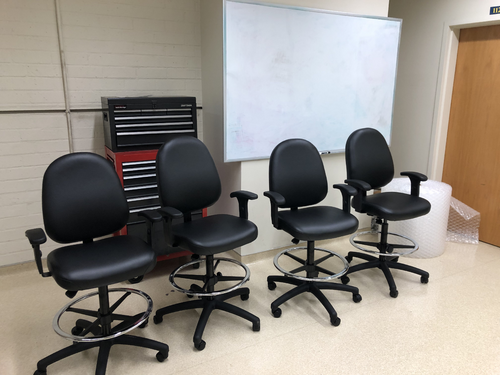
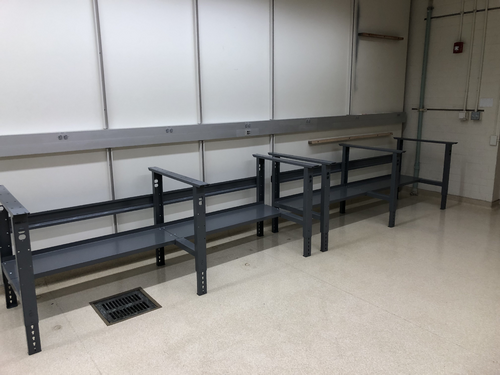
Started assembly of the workbench equipment today. We completed the stools, and have constructed the frames of each workbench. All that needs to be added are the tabletops and the top shelves, which will be done on Monday. |
| Attachment 1: IMG_7569.jpg
|
|
| Attachment 2: IMG_7568.jpg
|
|
|
273
|
Mon Nov 20 20:45:16 2023 |
Aiden | Update | VAC | Leak Test |
[Aiden, Luis]
Tested every weld and flange to find leaks. Only found that the flange on the turbo pump and reducing nipple was still at 2e-9 torr on the leak. The chamber still rose in pressure when the two gate valves were closed but no noticeable leak could be found on the lid or welds. |
|
272
|
Mon Nov 20 20:37:45 2023 |
Aiden | Update | VAC | Clean and Bake Batch 20 |
| [Aiden, Luis]
Started to clean and bake the macor parts for the FROSTI reflector. Per LIGO documentation cleaned the macor in liquinox for 10 minutes and put them in the oven at 200 degC for 24 hours. |
|
271
|
Mon Nov 20 10:10:50 2023 |
Tyler | Configuration | Electronics | RTD Logic/Schematic Diagrams |
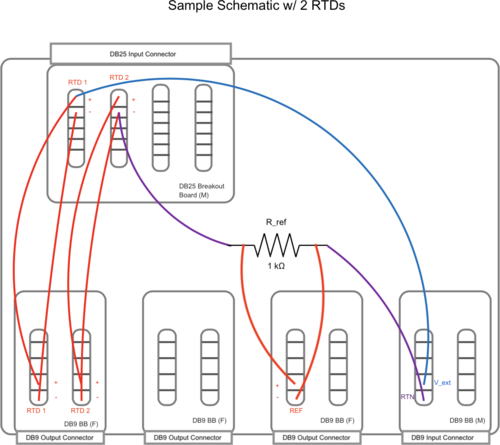
Below are a basic diagram of what the RTD measurement circuit logically looks like and an example schematic of the actual wiring. The schematic wiring will be placed internally into a chassis, connected to the RTDs via DB25 cable.
Note: The DB25 Breakout Board connector is Female, not Male. |
| Attachment 1: FIN_RTD_circuit.png
|

|
| Attachment 2: Sample_Circuit_Schematic.png
|
|
|
270
|
Fri Nov 17 14:06:01 2023 |
Shane | Update | Cleanroom | 5 zone particle count |
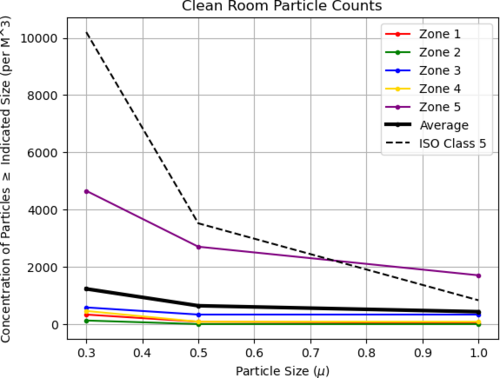
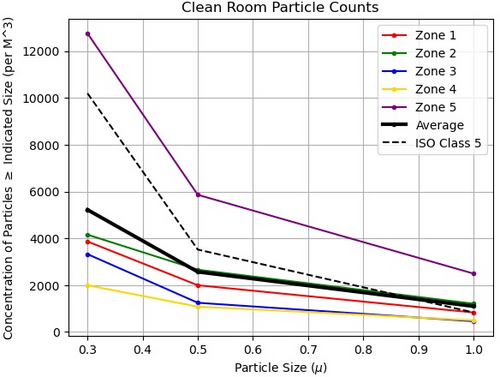
| Here's today's 5 zone particle count measurement for the cleanroom. Zone 5 (closest to back wall by fire cabinet) is still above the limit for the larger size ranges; everything else is in good shape and roughly 10 times under the limit. Not sure why zone 5 is still so dirty (maybe some of the electronics being stored in bags/bins on the upper shelf of the desk aren't clean?) but will focus cleaning efforts on this zone next time. |
| Attachment 1: 23.png
|
|
|
269
|
Thu Nov 16 19:32:31 2023 |
Aiden | Update | VAC | VAC HC Levels Update |
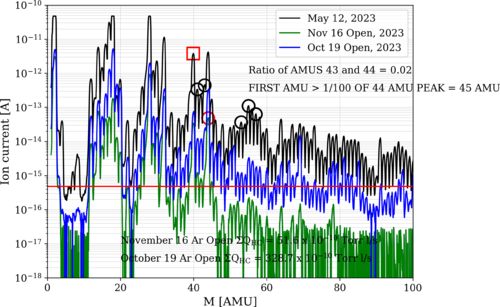
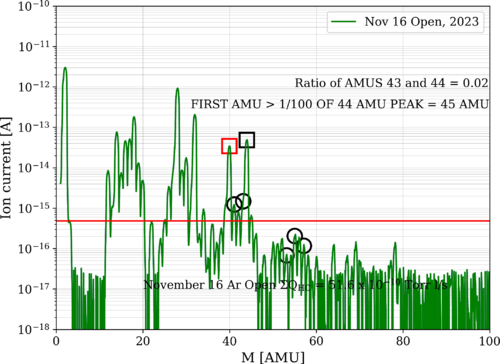
| Took some more RGA data today and overlaid it with data taken from October 19. I added a red line that symbolizes where all amu peaks above 44 need to be bellow as well as a black square around the 44th amu peak. The chamber is very close to being meeting LIGO's vacuum chamber standards. |
| Attachment 1: bake7_231116_ArO.png
|
|
| Attachment 2: November_15_Ar_Open_Analyzed.png
|
|
|
268
|
Thu Nov 16 17:12:42 2023 |
Luis, Shane, Mohak | Update | Cleanroom | Cleanroom cleaning and particle count |
|
[Shane, Luis, Mohak]
cleaning cleanroom and particle count
- 3:37 pm: started particle count
- zone 3:
- 0.3 u: 1205
- 0.5 u: 748
- 1.0 u: 249
- zone 4:
- 0.3 u: 1496
- 0.5 u: 748
- 1.0 u: 290
- 3:57 pm: began surface check and wipedown, including softwalls. NOTE: vacuum chamber insulation crumbling at edges, dropping loose flakes. Scatters residue whenever jostled, so wiping it down just releases more. Not enough flakes are being released for it to be a major issue, but definitely something to keep an eye on.
- 4:18 pm: started vacuuming the floor
- 4:29 pm: finished vacuuming the floor
- 4:30 pm: started mopping the floor
- 4:35 pm: finished mopping the floor
- 4:36 pm: started cleaning the buckets
- 4:41 pm: started mopping with IPA wipes
- 4:52 pm: finished mopping with IPA wipes
- 4:52 pm: changed sticky floor mats
- 4:53 pm: started particle count
- zone 3:
- 0.3 u: 3367
- 0.5 u: 1787
- 1.0 u: 914
- zone 4:
- 0.3 u: 1039
- 0.5 u: 498
- 1.0 u: 249
|
|
267
|
Wed Nov 15 21:52:33 2023 |
Aiden | Update | VAC | Vacuum Chamber Baking Update |
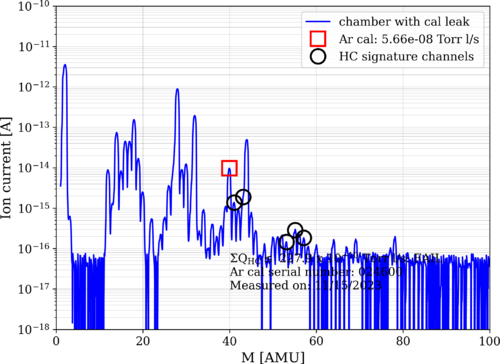
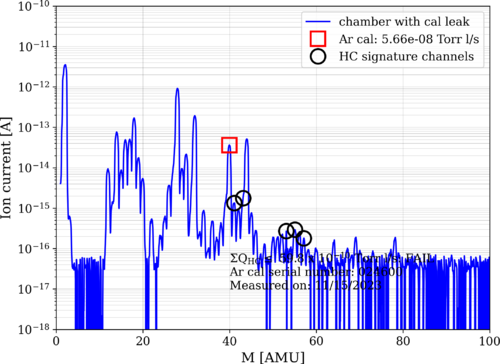
| Took RGA data before running the degas mode. Made sure to close off the main volume before running the degas. And left the filament on. |
| Attachment 1: bake7_231115_ArC.png
|
|
| Attachment 2: bake7_231115_ArO.png
|
|
|
266
|
Tue Nov 14 17:21:40 2023 |
Jon | Update | VAC | RGA best practices |
As a follow up ELOG 261, I have received advice from one of the vacuum experts at LIGO Hanford on best practices for our RGA:
-
For future RGA degassing, definitely keep the main volume isolated, since it could contaminate the main volume with everything that just got cooked off of the filament. So the procedure should be to (i) close both gate valves, (ii) ensure the angle valve on the bypass line is open, (iii) initiate the degas cycle on the RGA, (iv) pump the RGA volume through the bypass line, until its pressure returns to its pre-degas level.
-
Repeated degassing of the filament will definitely wear it down much faster, so do this operation sparingly.
-
As long as the pressure of the RGA volume is in the UHV range (~1e-9 torr), best practice is to leave the filament on. This keeps it hot which helps prevent particulate from settling on it. However the electron multiplier should stay off when not actively taking scans, as it will wear down if left on all the time.
|
|
265
|
Mon Nov 13 11:23:54 2023 |
Jon | Update | CDS | CyMAC testing |
[Jon, Shane, Luis]
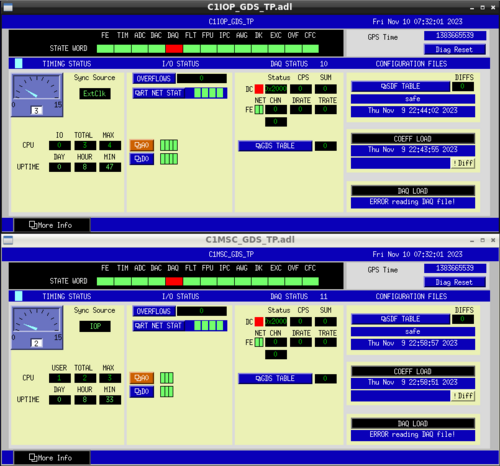
My repair of the internal ribbon connecting the ADC to the adapter board resolved the timing signal problem. After this repair, we were able to start the front-end IOP model and checked out the RTS diagnostic screens (pictured below). All indicator lights were green except for the DK flag (indicating the DAC outputs are not enabled) and the DAQ flag (indicating that the system is recording data to disk). Those were both as expected, because the DAQD data acquisition service was not set up yet and the DAC outputs are not enabled until at least one user model (which outputs signals to the DAC) is started. I created and installed a simple user model (C1MSC) and confirmed that the DK flag clears once this model starts.
I later attempted to set up the DAQD service, which is needed to save data, but am yet to successfully debug it. I have received some guidance from one of LIGO's CDS experts and will try it at my next opportunity for lab work. |
| Attachment 1: Cymac_GDS_Diagnostics.png
|
|
|
264
|
Mon Nov 13 11:07:50 2023 |
Tyler | Update | VAC | RTD Analysis |
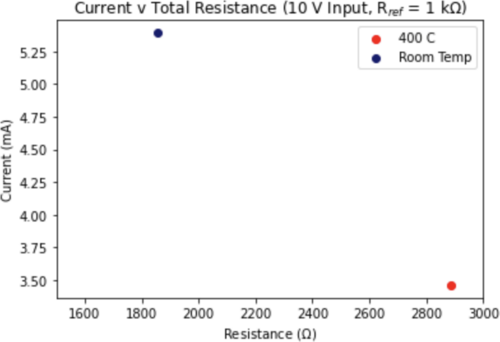
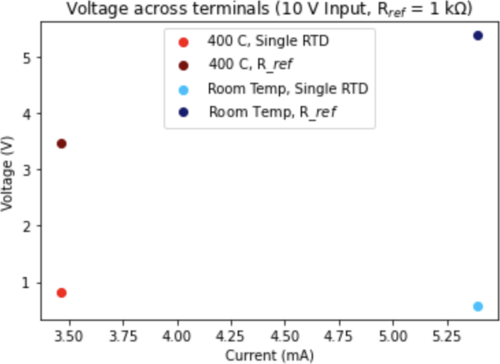
After initial analysis from last week on a single RTD, I then extended to looking at all 8 in series with R_ref (set to 1 kOhm). Shown below are the edge cases for the setup:
- RTDs are all at ambient lab temperature. This would correspond to a minimum resistance value.
- RTDs all read out 400 C. This gives the maximum resistance value.
The results show that indeed only a few mA of current is drawn even at room temperature (a little above 5.5 mA), and this will continue to decrease with increasing temperature. The voltage across a single terminal, at a maximum, is only about 5.4 V. |
| Attachment 1: Screenshot_2023-11-13_at_11.05.45_AM.png
|
|
| Attachment 2: Screenshot_2023-11-13_at_11.06.04_AM.png
|
|
|
263
|
Mon Nov 13 06:15:45 2023 |
Peter | Update | VLC Update | VLC Mode Matching |
| Weekly Updates Attached in pdf |
| Attachment 1: VLC_Mode_Matching_3.pdf
|

|
|
262
|
Fri Nov 10 14:16:04 2023 |
shane | Update | Cleanroom | new cleanroom zone diagram |
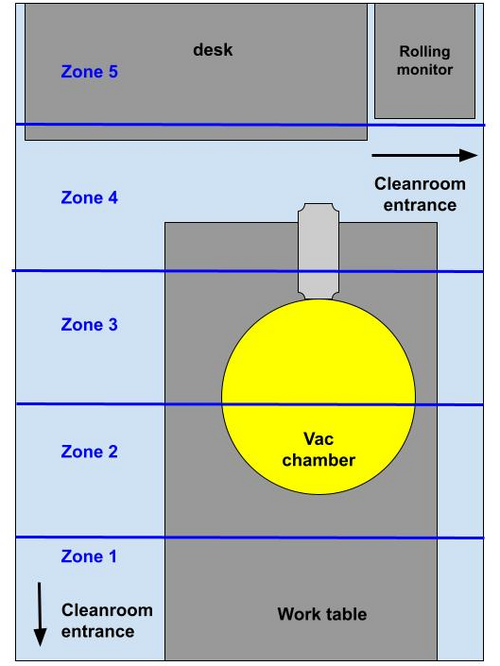
| since the vac system has been moved and made permanent, here's a new diagram of the cleanroom zones. The zones themselves haven't moved, but the diagram has been updated to reflect the new set up of the cleanroom. |
| Attachment 1: cleanroom_zones_nov2023.jpg
|
|
|
261
|
Fri Nov 10 08:32:34 2023 |
Jon | Update | VAC | RGA experiments |
I ran a 3-minute degas cycle of the RGA filament for the first time yesterday (in this process, the filament gets very hot in order to "boil off" settled particulate). I was surprised to see the pressure (of not just the RGA volume, but also the main volume) rise from 2e-8 to 5e-6 torr.
This observation, plus the rise in pressure seen every time the filament is activated for an RGA scan, indicates we have significant particulate settling on the RGA filament. This may be systematically biasing RGA scans taken within a short time (~15 minutes) of turning on the filament.
I have two ideas to reduce particulate on the RGA. However, before implementing these, I first want to consult with the vacuum experts at LIGO Lab.
- Run a second RGA degas cycle, but next time with the main volume valved off with only the RGA volume being pumped (through the bypass line). This will prevent "boiled off" particulate from entering the main chamber and will also increase the pumping rate for the RGA volume, reducing the amount of particulate that resettles on the RGA filament.
- I also noticed that the SRS manual states that the filament is designed to be long-lived and it is recommended to leave it on any time the RGA is on. By leaving the filament on all the time (i.e., hot), we could reduce the amount of particulate that is evidently settling on it between scans. I am checking whether LIGO Lab does this in their own chambers.
|
|
260
|
Thu Nov 9 19:06:46 2023 |
shane | Update | Cleanroom | 5 zone cleanroom measurement |
| Here's today's five zone measurement, taken ~5 hours after the cleaning. Zone 5 (closest to fire cabinet and back wall) is a bit over the limit in all size ranges (about 1500 particles in 1.0u size range over), and zone 2 is slightly over the limit in the 1.0u range, but everything else is under the requirement. |
| Attachment 1: 23.jpeg
|
|
|
259
|
Thu Nov 9 13:57:58 2023 |
Shane, Luis, Aiden, Tyler | Update | Cleanroom | cleanroom cleaning and particle count |
|
[Aiden, Shane, Luis, Tyler]
cleaning cleanroom and particle count
- 12:30 pm: Tyler and Aiden started organizing cables in cleanroom
- 12:35 pm: started particle count in flow bench
- 0.3 u: 11681
- 0.5 u: 3284
- 1.0 u: 1039
- 12:50 pm: started cleanroom particle count
- zone 3:
- 0.3 u: 14549
- 0.5 u: 10351
- 1.0 u: 6194
- zone 4:
- 0.3 u: 10808
- 0.5 u: 4655
- 1.0 u: 1953
- 1:07 pm: began surface check and wipedown, including softwalls
- 1:19 pm: started vacuuming the floor
- 1:28 pm: finished vacuuming the floor
- 1:29 pm: started mopping the floor
- 1:33 pm: finished mopping the floor
- 1:34 pm: started cleaning the buckets
- 1:37 pm: started mopping with IPA wipes
- 1:39 pm: finished mopping with IPA wipes
- 1:40 pm: changed sticky floor mats
- 1:41 pm: started particle count
- zone 3:
- 0.3 u: 8397
- 0.5 u: 5071
- 1.0 u: 2618
- zone 4:
- 0.3 u: 6651
- 0.5 u: 4323
- 1.0 u: 2120
|
|
258
|
Thu Nov 9 13:48:47 2023 |
Aiden | Update | VAC | Vacuum Chamber Baking Update |
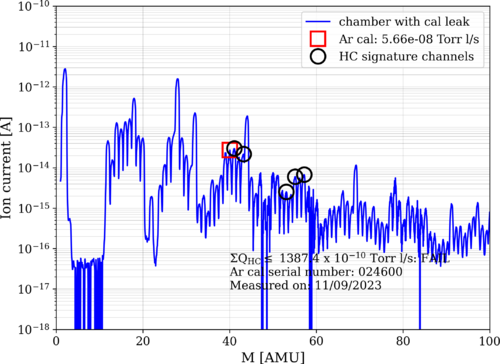
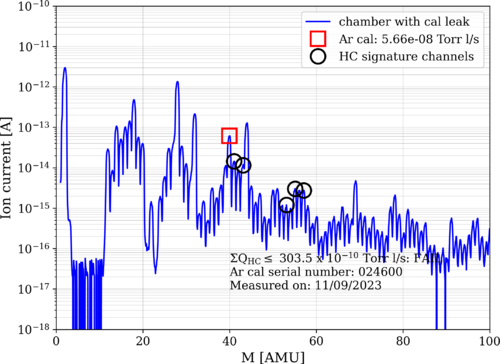
| After bake 7 was stopped on Wednesday morning (11,8,2023), I took RGA data of the chamber to compare to a later scan that will be done on Monday to make sure the chamber has reached its lowest pressure. Below are the graphs. |
| Attachment 1: bake7_231109_ArC.png
|
|
| Attachment 2: bake7_231109_ArO.png
|
|
|
257
|
Wed Nov 8 17:55:49 2023 |
Jon | Update | General | Lab Clean-Up Day 1 |
[Jon, Tyler, Shane, Peter, Luis]
Today we completed the first phase of lab clean-up. Activities included:
- CF/KF parts stored under the cleanroom table were removed and transferred to Physics 1129
- Cleanroom workbench cleared, with all FROSTI hardware collected into one of the large SS bins
- High surfaces outside the cleanroom (lights, table enclosure frames, rack, cabinets) wiped down with IPA wipes
- Floor HEPA-vacuumed outside the cleanroom
- Sticky mats changed throughout the lab
Tomorrow, we will complete turn-over of the cleanroom (HEPA vacuuming of floors, mopping of floors, IPA wiping of softwalls and work surfaces). Shane will post a forthcoming measurement of the cleanroom particulate levels, post-turnover. |
|
256
|
Mon Nov 6 11:31:25 2023 |
Peter | Update | VLC Update | VLC Mode Matching |
| See Update Attached |
| Attachment 1: VLC_Update_11_6_23.pdf
|

|
|
255
|
Mon Nov 6 11:29:24 2023 |
Tyler | Update | Electronics | Preliminary RTD Calculations, RP Software Update |
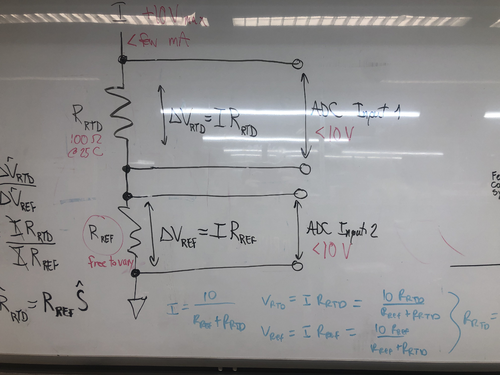
Preliminary RTD calculations are shown below, given an input of 10 V and desiring a few mA of current. It looks like R_ref should be at least 1 kOhm (refer to plots/circuit below), keeping in mind we need to have <10 V input for the ADC.
RP: The Red Pitaya Software was updated to OS 2.00. All examples on the RP website should run without issue. |
| Attachment 1: cvt.png
|

|
| Attachment 2: VvC.png
|

|
| Attachment 3: IMG_7471.jpg
|
|
|
254
|
Thu Nov 2 17:14:36 2023 |
Shane, Jon | Update | CDS | CyMAC set up permanentized |
|
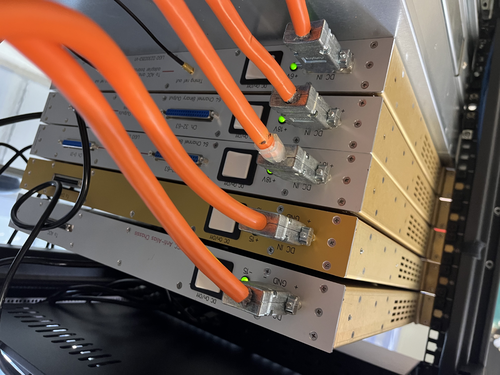
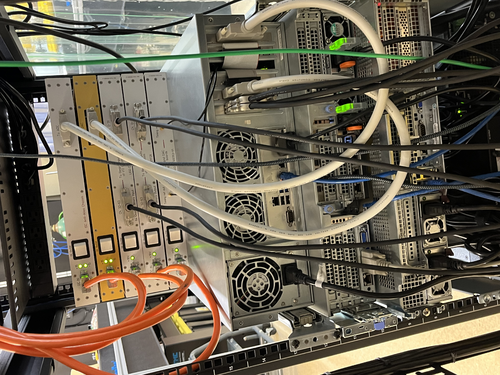
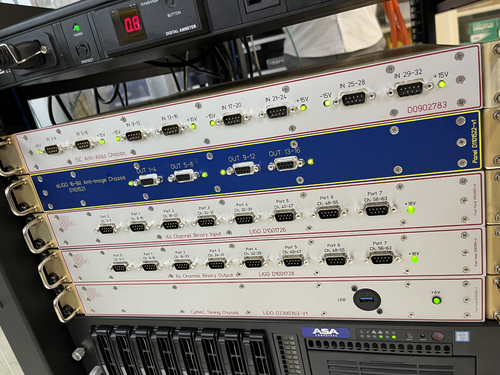
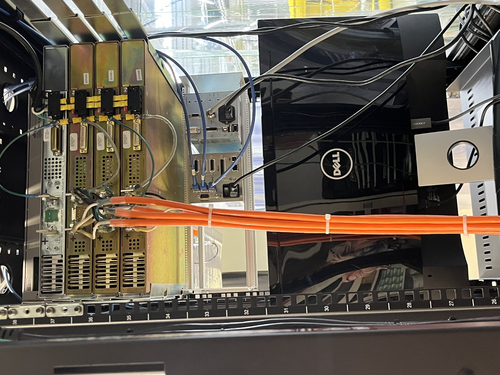
CyMAC connections have been finalized and made permanent. Also tested voltages, which are all looking good. Warning: power is on. Do not touch power supply terminals or screws connected to grounding cables (see attached images 4 and 5; green wires on back of power supply with black and yellow covers, and exposed positive and negative terminals on back of power supply).
Also established connections from Anti-Aliasing chassis to ADC adapter board, Anti-Imaging chassis to DAC adapter board, and binary in/out chassis to BIO card, all mounted within Cymac host computer. Turned on CyMAC and ran test model, received error message likely pointing to timing signal not being successfully passed to the adapter boards. Next steps are checking to make sure correct timing signal is actually being output, and then checking internal ribbon cable in host chassis, which is another potential cause of the error.
|
| Attachment 1: cymac_chassis_back.jpeg
|
|
| Attachment 2: cymac_chassis_back2.jpeg
|
|
| Attachment 3: cymac_chassis_front.jpeg
|
|
| Attachment 4: final_connections_back_of_power_supply.jpeg
|
|
| Attachment 5: power_supply_back.jpeg
|
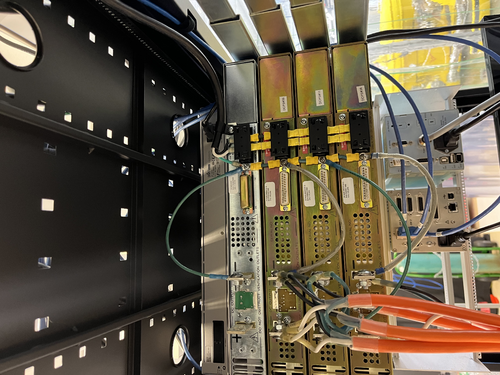
|
|
253
|
Wed Nov 1 20:22:07 2023 |
Aiden | Update | VAC | VAC System Heating Update |
| Raised the PID controller temperature to 105C today as at that temperature the lid and the barrel temperature sensors were reading around 120C. I will check again tomorrow to see if there is any room for increase after equilibrium. |
|
252
|
Wed Nov 1 18:24:01 2023 |
Shane | Update | CDS | CyMAC Power connections made |
Finished power connections today for the CyMAC chassis. Images attached. Had to switch the shrink fork terminals on the power supply cables to shrink ring terminals, but was able to get everything connected and secured. Upcoming work: turning on power supply and testing voltages/checking everything is turning on and lighting up correctly.
Configuration is as follows:
- Topmost Sorensen: +24V (reserved for FROSTI)
- Negative terminal: [negative terminal is grounded]
- jumper to Sorensen ground screw
- Sorensen 2nd from the top: +18V
- Positive terminal:
- white power cable wire for AA chassis
- white power cable wire for AI chassis
- white power cable wire for BI chassis
- white power cable wire for BO chassis
- Negative terminal: [negative terminal is grounded]
- jumper to Sorensen ground screw
- black power cable wire for AA chassis
- black power cable wire for AI chassis
- black power cable wire for BI chassis
- black power cable wire for BO chassis
Sorensen 3rd from the top: -18V
- Positive terminal:[positive terminal is grounded]
- jumper to Sorensen ground screw
- green power cable wire for BI chassis
- green power cable wire for BO chassis
- Negative terminal:
- green power cable wire for AA chassis
- green power cable wire for AI chassis
Bottommost Sorensen: +6V
- Positive terminal:
- white power cabe wire for timing chassis
- Negative terminal: [negative terminal is grounded]
- jumper to Sorensen ground screw
- green power cable wire for timing chassis
- black power cable wire for timing chassis
|
| Attachment 1: cymac_power_connected.jpeg
|
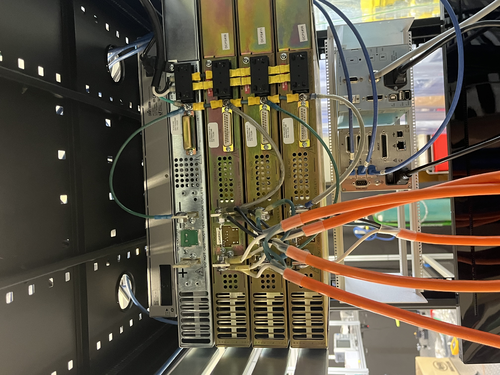
|
| Attachment 2: cymac_power_connections_back.jpeg
|
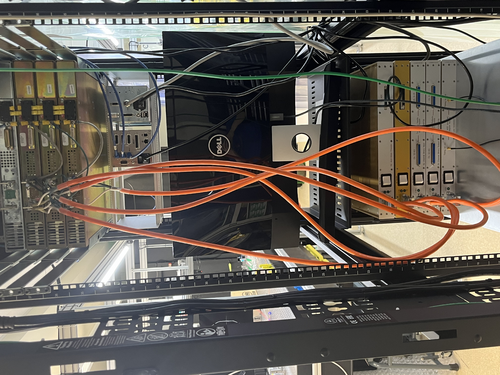
|
|
251
|
Tue Oct 31 19:46:35 2023 |
Aiden | Update | VAC | VAC System Heating Update |
| Started bake 7 on Monday but found issues with the heating as the cross in front of the RGA got way too hot too quickly. This resulted in shutdowns of the heater tape while I could still only set the main PID controller for the lid to 75C. Tuesday I moved the PID controller sensors to be on the cross in front of the RGA and on the Reducing nipple. I then placed the alarm sensors onto the lid of the chamber and the barrel. This should hopefully prevent excessive heating on then smaller components. I also started the bake again Tuesday, but only set the temperature to 85C for now and will increase it further tomorrow when I get a good idea of the equilibrium point of the chamber. |
| Attachment 1: IMG_4745.jpg
|
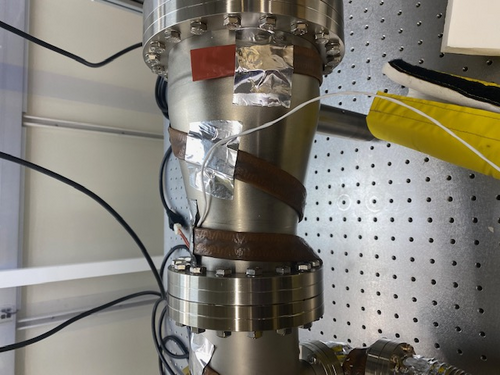
|
| Attachment 2: IMG_4744.jpg
|
|
|
250
|
Mon Oct 30 18:15:13 2023 |
Shane | Update | CDS | CyMAC chassis mounted and progress on power connections |
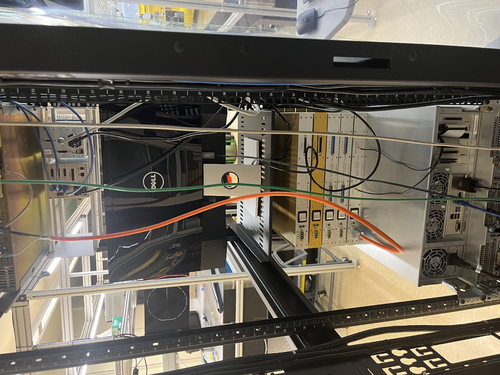
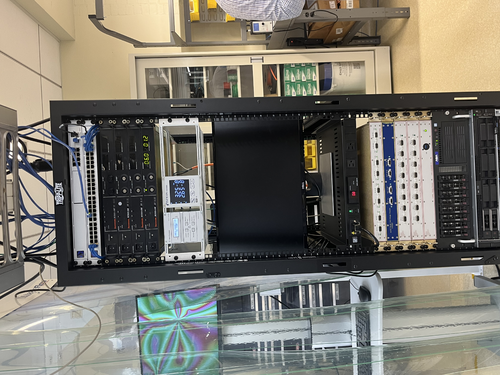
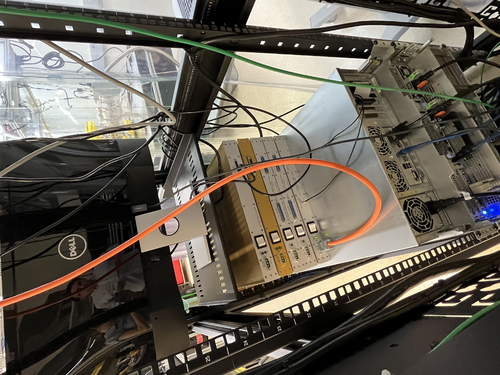
| All CyMAC chassis mounted in electronics rack today, and shelf for monitor also mounted. Images attached. Assembled grounding cables for power connections, and attached the timing chassis to power & gnd. Powered on successfully with correct voltages in expected places. After power test, everything was turned off and unplugged. Next steps: attach grounding cables to other four power supply chassis. Also attach anti-aliasing, anti-imaging, binary input and binary output chassis to power supply. |
| Attachment 1: electronics_rack_back.jpeg
|
|
| Attachment 2: electronics_rack_front.jpeg
|
|
| Attachment 3: mounted_chassis.jpeg
|
|
| Attachment 4: power_supply.jpeg
|
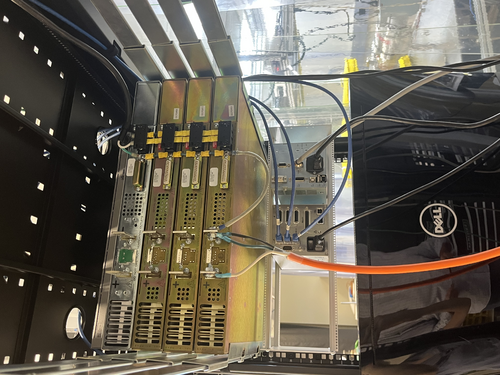
|
|
249
|
Mon Oct 30 11:03:56 2023 |
Tyler | Update | Scripts/Programs | |
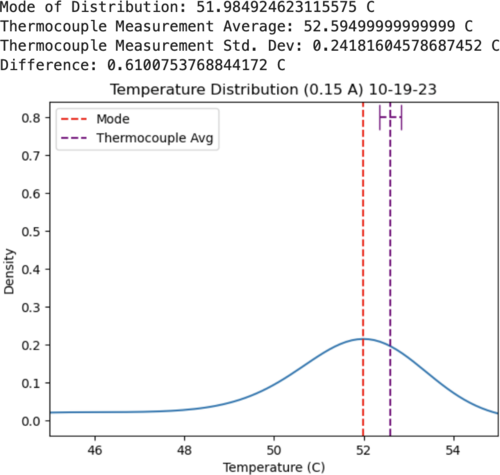
FLIR: After some adjustments, the plot generated from the FLIR measurements look much more symmetric (see attachment). There are more included grid points, which smooths out the curve as compared to last week.
Red Pitaya: It looks like a new OS update was released for the RP, which includes a new Python API (was previously only available in C). I'm going to try and update the one we have currently running in lab.
|
| Attachment 1: Screenshot_2023-10-23_at_12.39.05_PM.png
|
|
|
248
|
Mon Oct 30 08:42:22 2023 |
Jon | Update | VAC | Vacuum Leak Test |
By 5:30 pm Friday, the pressure had reached 8.6e-8 torr and was continuing to fall. So it seems we are OK to proceed with permanentizing this configuration (cable routing, heater tape reinstallation).
| Quote: |
| Leak tested the worst flanges on the chamber after moving it and after bake 6. The 6 inch flange connected to the 8 inch reducing nipple is now leaking at 1.5 e-9, previously at 4 e-9. The 8 inch flange connected to the turbo pump is now leaking at 1.9 e-9, previously at 3 e-9. This means that the baking most likely improved the seals on these flanges and a hotter bake might fix the leaks for good. |
|
| Attachment 1: IMG_0659.png
|
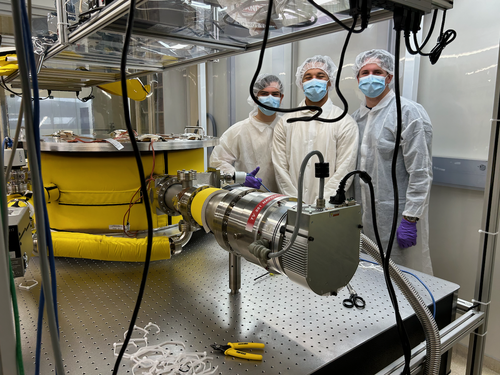
|
| Attachment 2: IMG_0660.png
|
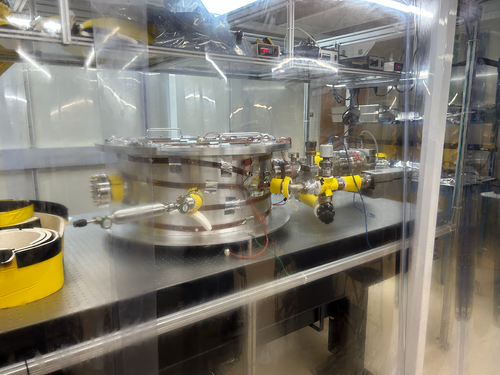
|
|
247
|
Fri Oct 27 15:28:30 2023 |
Shane | Update | CDS | AA and AI chassis for CyMAC powered on and functional |
| CyMAC updates: Switched out the faulty power regulator boards in the Anti-Aliasing and Anti-Imaging chassis. Both chassis are now powering up correctly with lights on and the correct voltages in/out of the power regulator board. Images attached. All chassis for the CyMAC now functional, so next step is mounting everything in the rack. |
| Attachment 1: AI_chassis_lights_on.jpeg
|
|
| Attachment 2: AA_chassis_lights_on.jpeg
|
|
|
246
|
Fri Oct 27 15:16:31 2023 |
Aiden | Update | VAC | Vacuum Leak Test |
| Leak tested the worst flanges on the chamber after moving it and after bake 6. The 6 inch flange connected to the 8 inch reducing nipple is now leaking at 1.5 e-9, previously at 4 e-9. The 8 inch flange connected to the turbo pump is now leaking at 1.9 e-9, previously at 3 e-9. This means that the baking most likely improved the seals on these flanges and a hotter bake might fix the leaks for good. |
|
245
|
Thu Oct 26 13:00:45 2023 |
Aiden | Update | VAC | Vacuum Chamber Baking Update |
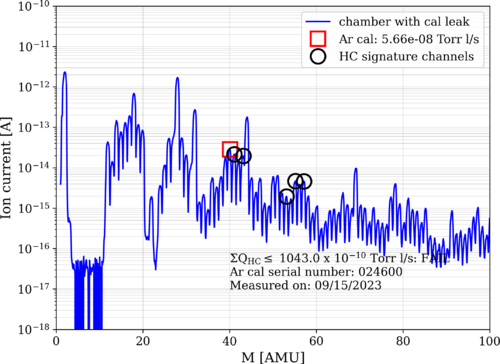
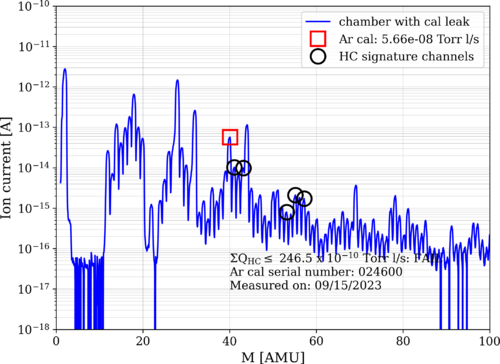
| Bake 6 was turned off on Monday. Tooke RGA data today and have posted the data below. The pressure of the chamber after taking data was 3.22 e-8 Torr. The chamber HC levels are still not low enough but I feel with more pumping it will go down as the RGA scan was still slowly going down during the data taking. |
| Attachment 1: bake6_231026_ArC.png
|
|
| Attachment 2: bake6_231026_ArO.png
|
|
|
244
|
Mon Oct 23 18:02:23 2023 |
Shane, Jon | Update | CDS | Timing chassis assembly complete |
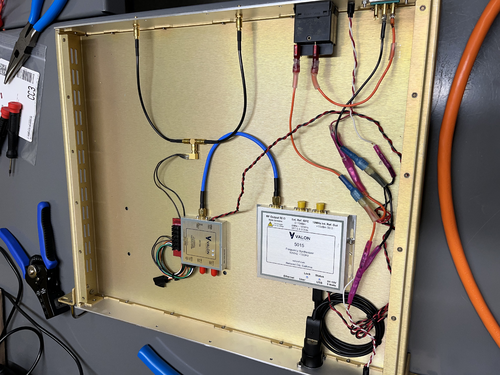
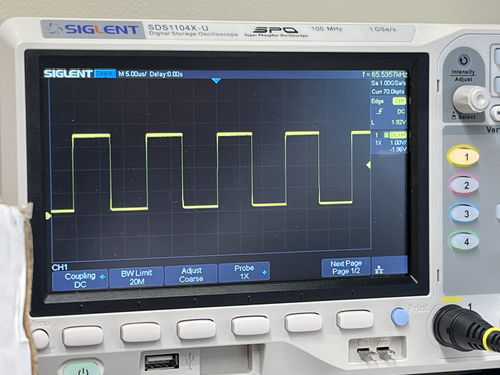
| Concluded assembly of timing chassis for CyMAC today; see attachment 1 for interior set up of chassis. Installed front and rear panels, wired on/off switch and LED assembly, and tested to confirm everything is powering on correctly. Also tested the outputted timing reference that will go to DAC and ADC adapter boards (see attachment 2 for output 1 and attachment 3 for output 2). |
| Attachment 1: timing_chassis_complete.jpeg
|
|
| Attachment 2: timing_chassis_output_1.jpeg
|
|
| Attachment 3: timing_chassis_output_2.jpeg
|
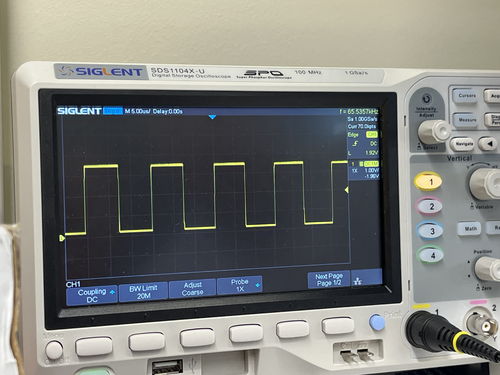
|
|
243
|
Mon Oct 23 11:28:05 2023 |
Tyler | Update | Cameras | FLIR Camera Code Updates |
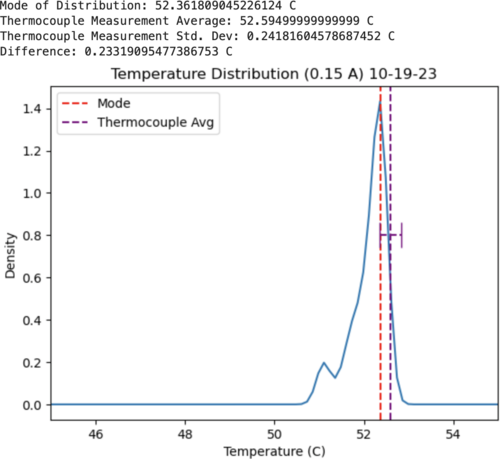
| The past week I've been spending time going through the FLIR code on gitlab. Initially, it had appeared that our measurements with the camera had differed about 2 degrees C from what the thermocouple was giving (Ref ELOG 181). Upon inspection of the FLIR streaming code, I noticed a few issues:
1. The emissivity value wasn't set correctly (was 0.999 originally, should be about 0.95).
2. The ambient temperature was set to about 21.6 C (71 F).
3. The distance given before was about an inch off from what I measured.
These three parameters all must be manually specified to calculate the temperature values, and are what I assume caused the larger temperature difference seen before. I've attached a new set of measurements that I took below, where 6 images were taken by the camera, looking at a heating source with a current of 0.15 A being driven. The difference between the camera and the thermocouple were much smaller, as seen below. I'd still like to take a few more measurements to solidify that this has rectified the issue, but at the moment it seems this is working much better.
Images at: https://drive.google.com/drive/folders/1VDvZ1rfEGWsHq1AgG-chde3Cd8Do_piD?usp=sharing |
| Attachment 1: Screenshot_2023-10-23_at_11.06.04_AM.png
|
|
|
242
|
Mon Oct 23 07:28:57 2023 |
Peter | Update | VLC Update | VLC Mode Matching |
| I have attached a pdf with slides of my latest updates. |
| Attachment 1: Carney_VLC_Update.pdf
|

|
|
241
|
Fri Oct 20 16:38:02 2023 |
Shane, Aiden | Update | Cleanroom | Cleanrooom cleaning and particle count |
|
[Aiden, Shane]
cleaning cleanroom and particle count
|
|
240
|
Thu Oct 19 11:41:04 2023 |
Aiden | Update | VAC | Vacuum Chamber Baking Update |
| [Aiden, Tyler, Mohak]
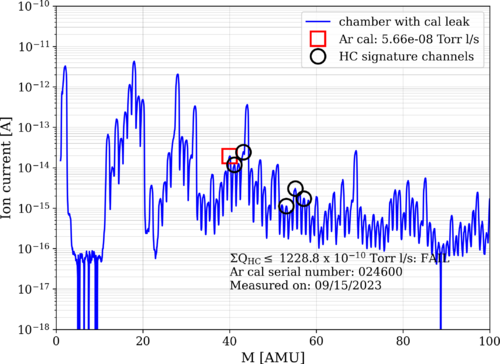
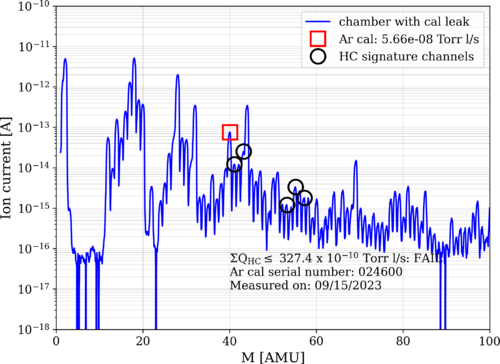
Took some RGA data when we came into the room. The pressure of the chamber was 8.63e-8 Torr before turning on the RGA filament. We saw the usual spike in pressure when the filament was initially turned on. Took some data and saw that the chamber was definitely dirtier since the vacuum upgrade. See figures below.
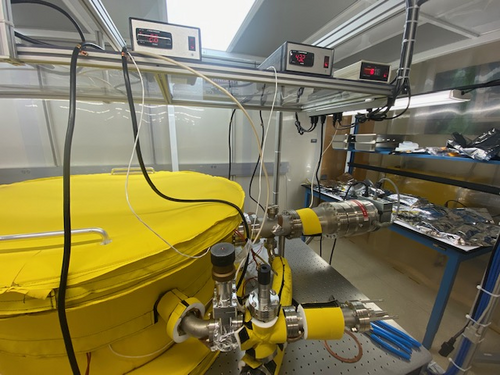
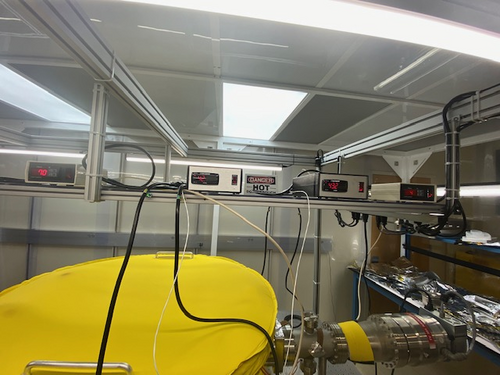
Put the heater tape back onto the section that was removed. We may need to rearrange the heater tape again as there was not much heater tape to go around the upgraded section. We also tried to get some of the extra insulation around this section and we able to get some on around the 6-8 inch reducer.
We then took off the electronics for the gauges and the RGA, added the new extension cords to the PID controllers, and then started bake 6 which will go to 120 degC and stay that way until most likely Monday. The pressure before starting the bake was 8.28e-8 Torr.
|
| Attachment 1: bake5_231019_ArC.png
|
|
| Attachment 2: bake5_231019_ArO.png
|
|
| Attachment 3: IMG_4717.jpg
|
|
| Attachment 4: IMG_4716.jpg
|
|
| Attachment 5: IMG_4715.jpg
|
|
| Attachment 6: bake5_231019_ArO.png
|

|
|
239
|
Thu Oct 12 12:11:10 2023 |
Aiden | Update | VAC | Vacuum chamber Helium leak test |
| [Aiden, Tyler, Peter, Jon]
Continued tightening bolts on the turbo pump and 6"-8" reducer to reduce the leak. The final leak test values for the turbo pump flange was 3.0 e-9 and the other 6"-8" reducer flange was 4.0 e-9.
We will continue to let it pump down as the screws could not be tightened anymore. Looks like new gaskets will be needed to reduce the leaking on these flanges.
|
| Attachment 1: IMG_4689.jpg
|
|
| Attachment 2: IMG_4688.jpg
|
|
|
238
|
Wed Oct 11 20:47:11 2023 |
Jon | Update | VAC | Vacuum upgrade begins |
[Jon, Tyler, Aiden, Peter]
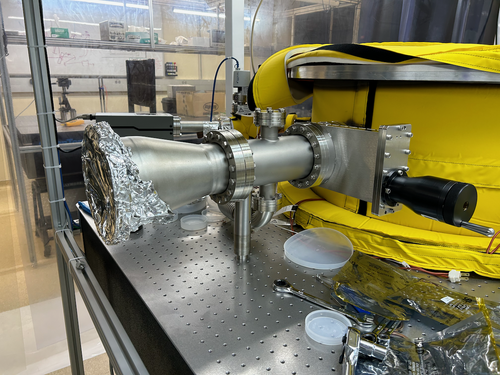
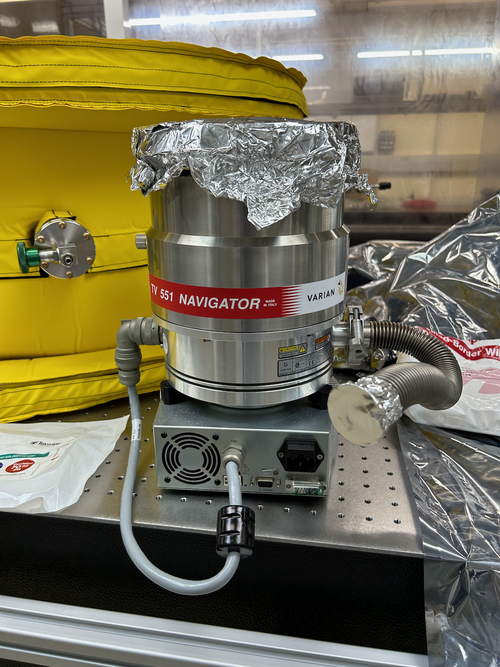
Upgrade of the UHV system to a larger turbo pump began today. After obtaining a final RGA scan in the old configuration (Aiden to post), we vented all three volumes and proceeded to disassemble the 4.5"-diameter pump line. We completed installation of the new 6"-diameter pump line to the point where the new turbo pump will attach. This includes a 6" manual gate valve, 6"/2.75" reducing cross, and 6"/8" conical reducing nipple, as pictured below. Strain relief was also installed due to the longer length and greater weight of the new fittings.
Tomorrow we will continue with attaching the Varian TV 551 pump and perform a pump-down test. If this pump is confirmed to be operable, then we will relocate the entire system ~18" closer to the middle of the table and permanentize the setup. |
| Attachment 1: IMG_0619.png
|
|
| Attachment 2: IMG_0621.png
|
|
| Attachment 3: IMG_0618.png
|
|
|
237
|
Mon Oct 9 21:41:24 2023 |
Aiden | Update | Clean & Bake | Clean and Bake Batch 19 |
| Bagged and tagged the parts from batch 18. Started the Copper batch that includes all the gaskets needed to start the vacuum chamber upgrade. |
|
236
|
Mon Oct 9 16:59:21 2023 |
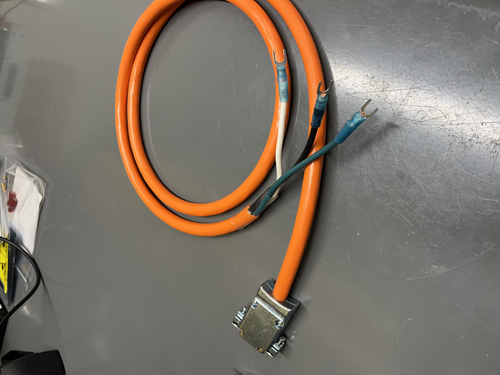
Shane, Jon | Update | CDS | timing chassis power cable and AI chassis testing for CyMAC |
[Shane, Jon]
Today's CyMAC work:
- Finished assembling external power supply cable for the timing chassis (see attached image)
- Also did some debugging of AA and AI chassis re: power issues. After testing voltages at various test points on the power regulator board (TP1-TP6) in the AA chassis, it seems like it's the source of the problem. Used bench DC power supply to test, running 15V, and the correct voltage is coming in to the board but something significantly smaller is being output. We're also getting unexpected negative signs on voltage at certain test points, with leads in correct positions
- Upon further examination, it looks like the lights on the filter boards are actually turning on (in both the AA and AI chassis), though it's only 2/4 lights on each board and they are very faint
- Corrected DC on/off switch spade lug orientation in AI chassis.
- Tested AI chassis power regulator board to see if the problem was the same, and found again that voltage coming in was correct, and voltage going out was not.
- In case of interest in exact numbers, results were as follows:
- Voltage difference between TP1(+Vin) and TP6(-Vin) is ~30V
- Voltage difference between grounded chassis wall and TP1 (+Vin) is ~15V
- Voltage difference between grounded chassis wall and TP6(-Vin) is ~-15 V
- voltage difference between TP2(+Vout) and TP5(-Vout) is ~3V
- Voltage difference between TP3 (gnd) and TP2(+Vout) is -0.065V
- Voltage difference between TP5(-Vout) and ground is ~3V
|
| Attachment 1: IMG_1457.jpeg
|
|
|
235
|
Mon Oct 9 11:29:37 2023 |
Tyler | Update | Electronics | PSD/CSD Plot Updates |
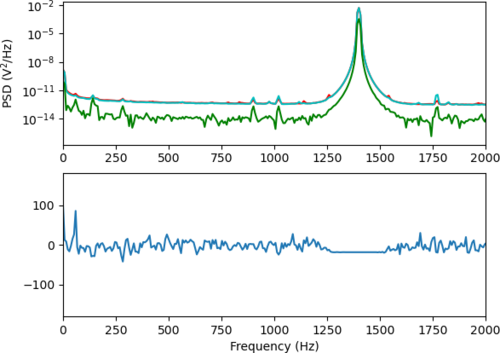
| Continuing from Sophia's SURF Project this summer: Plotting the Power-Spectral Densities (PSDs) and Cross-Spectral Densities of two signals.
A continued issue that has been observed in the plots is the random "jump" of one PSD curves. Below, a 1.4 kHz signal is driven with a magnitude of 0.7 Vpp, and connected to the two output ports of the Red Pitaya via an SMC T-Adapter. At the moment, I anticipate that this bug might have something to do with the Real-Time GUI code being used, since this hasn't been observed when running the calculations without it (see below). |
| Attachment 1: Screenshot_2023-10-09_at_11.20.25_AM.png
|

|
| Attachment 2: welch_csd-2.png
|
|
|
234
|
Mon Oct 9 11:06:17 2023 |
Peter | Update | VLC Update | VLC Launch Chain |
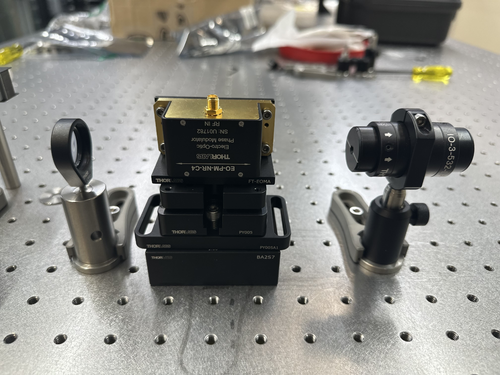
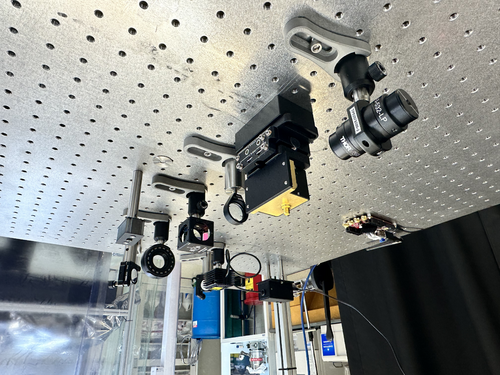
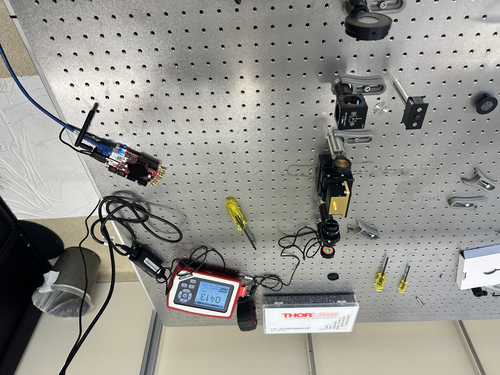
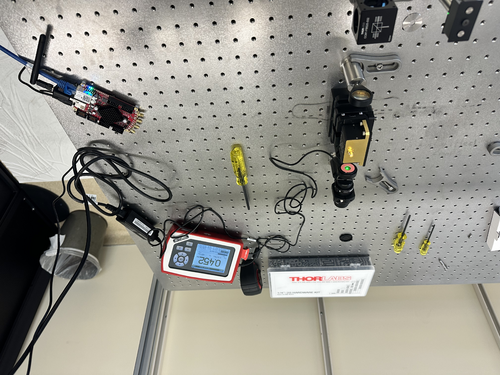
| Implemented the new stage for the EOM. Took power data at different positions in the launch chain. Beam waist: 0.066mm (beam waist is inside EOM). Power before EOM: 0.473mW. Power after EOM: 0.452mW. Power after Faraday Isolator: 0.415mW. Might need to adjust better to configure for clipping losses. Images of setup are attached below. |
| Attachment 1: IMG-3540.jpg
|
|
| Attachment 2: IMG-3538.jpg
|
|
| Attachment 3: IMG-3533.jpg
|
|
| Attachment 4: IMG-3522.jpg
|
|
|
233
|
Sat Oct 7 17:10:27 2023 |
Aiden | Update | Clean & Bake | Clean and Bake Batch 18 |
| Bagged and tagged the parts from Batch 17 and placed them in the clean room on the optic table. Also started an aluminum batch of parts that included the kf clamps and the heater mounting parts. |
|
232
|
Tue Oct 3 15:07:48 2023 |
Aiden | Update | Clean & Bake | Clean and Bake Batch 17 |
| Cleaned and baked all the stainless steel parts in Batch 17. Check data base for more details on this. |
|
231
|
Fri Sep 29 17:27:30 2023 |
Shane, Jon | Update | CDS | Timing chassis assembly progress (CyMAC) |
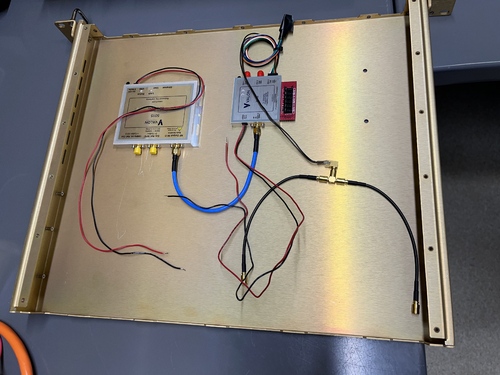
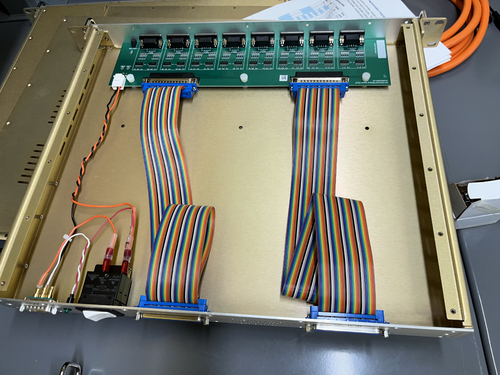
| Worked on timing chassis assembly today for the CyMAC, settled on layout (see attachment 1). Frequency synthesizer and frequency divider tentatively mounted. Next steps involve putting together and installing an LED and DC on/off switch assembly like the one in the binary input chassis (attachment 2 for comparison; orange and black wires in BI chassis analogous to red and black wires in timing chassis). Will also use front and back panels of BI chassis as a template for the timing chassis panels, with the following alterations: two SMB feedthroughs in place of the ribbon cable connections shown on the back panel, the addition of an LED on the front panel to indicate power, and potentially a spot on the front panel for usb connection to programmable frequency synthesizer. |
| Attachment 1: timing_chassis.jpeg
|
|
| Attachment 2: BI_chassis.jpeg
|
|
|
230
|
Fri Sep 29 11:53:54 2023 |
Shane | Update | Cleanroom | 5 zone particle count measurement in cleanroom |
| Today's 5 zone measurement of cleanroom particulate concentration is attached |
| Attachment 1: 23.png
|

|
| Attachment 2: 23.png
|

|
|
228
|
Fri Sep 29 11:22:33 2023 |
Shane, Aiden | Update | Cleanroom | cleaning and particle count |
|
[Aiden, Shane]
cleaning cleanroom and particle count
- 10:06 am: ran zero count test on particle counter
- 10:07 am: started particle count
- zone 3:
- 0.3 u: 2203
- 0.5 u: 831
- 1.0 u: 540
- zone 4:
- 0.3 u: 374
- 0.5 u: 124
- 1.0 u: 124
- 10:25 am: began surface check and wipedown
- 10:34 am: started vacuuming the floor
- 10:44 am: finished vacuuming the floor
- 10:45 am: started mopping the floor
- 10:49 am: finished mopping the floor
- 10:50 am: started cleaning the buckets
- 10:57 am: started mopping with IPA wipes
- 11:01 am: finished mopping with IPA wipes
- 11:02 am: changed sticky floor mats
- 11:03 am: started particle count
- zone 3:
- 0.3 u: 2535
- 0.5 u: 374
- 1.0 u: 166
- zone 4:
- 0.3 u: 581
- 0.5 u: 41
- 1.0 u: 0
|
|
227
|
Thu Sep 28 15:17:13 2023 |
Aiden | Update | Clean & Bake | Clean and Bake Batch 16 |
| Bagged and Tagged the parts from batch 15 and started baking batch 16 which includes the 6" to 8" reducer. |
|
226
|
Fri Sep 15 17:33:35 2023 |
Aiden | Update | VAC | Vacuum Chamber Baking Update |
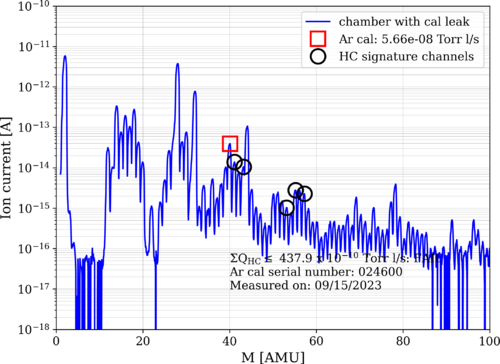
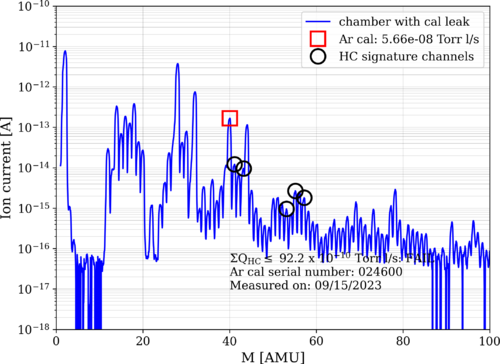
| Took some more RGA data and see that the chamber has gotten much cleaner since monday. Next step would be another bake with some focus around heating the RGA filament more. The pressure in the chamber before testing was 5.32 e-8 torr. |
| Attachment 1: bake5_230915_ArC.png
|
|
| Attachment 2: bake5_230915_ArO.png
|
|
|
225
|
Thu Sep 14 17:05:38 2023 |
Shane, Jon | Update | CDS | Timing chassis setup and testing |
| Tested the setup today for the timing chassis (intended to provide the timing reference for the CyMAC). Was able to read the correct frequency, but voltage was significantly lower than needed. Still identifying source of problem, and looking into the relationship between the supportable ohm load and the voltage. |