| ID |
Date |
Author |
Type |
Category |
Subject |
|
326
|
Tue Feb 13 13:02:41 2024 |
Pooyan | Update | Interferometer Simulations | Cacity sacn of Fabry-Perot |
| Created a simple model of Fabry-Perot cavity in SIS, and did a cavity scan. Total power in the cavity, 00 mode, and HOMs is measured. |
| Attachment 1: IFOSim_update_2_13_24.pdf
|

|
|
356
|
Wed Mar 27 00:03:57 2024 |
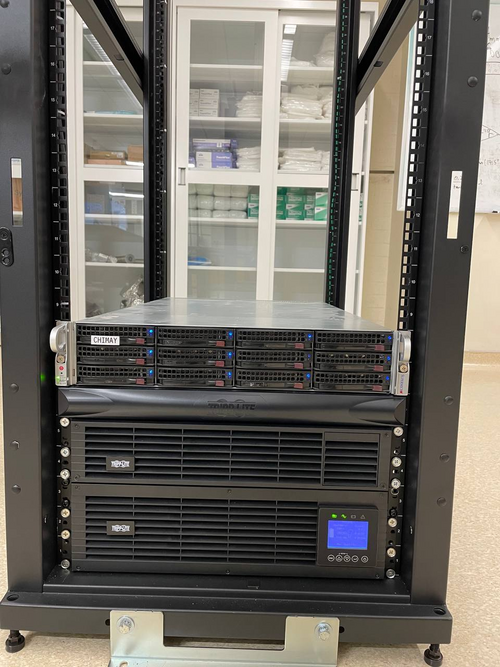
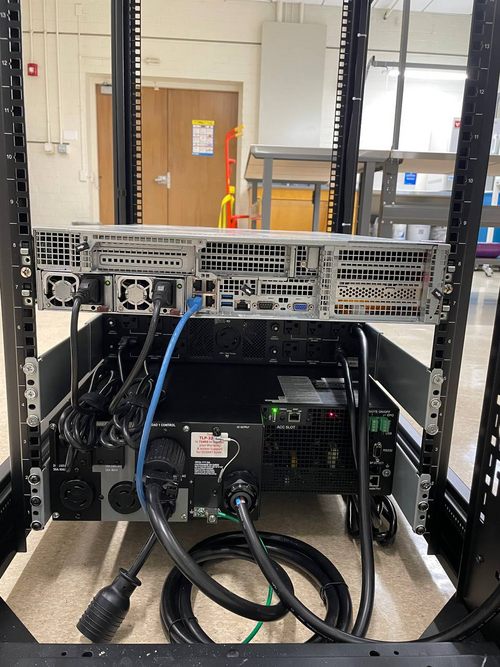
Pooyan | Update | Computers | Chimay relocation to Physics 1129 |
[Jon, Pooyan]
Moved Chimay from the server rack in Physics 1119 to a new rack in Physics 1129. It is connected to the switch in that rack and has the same ip address as before.
All services are up and running.
It appears that JupyterHub creates some processes whenever a user connects to an instance of it, but in some cases does not stop those processes after the user is not using that instance. This results in having lots of running idle processes, each using a small bit of the resources. Those processes are killed now as a result of rebooting. It might be a good idea to manually restart JupyterHub (or the whole machine) every few months to avoid this. |
| Attachment 1: Chima_front.jpg
|
|
| Attachment 2: Chimay_back.jpg
|
|
|
358
|
Mon Apr 8 14:43:29 2024 |
Pooyan | Update | Interferometer Simulations | SIS update single and coupled cavities |
| [Pooyan, Cynthia]
Attached is a brief recap PDF file. A video file showing separate HOMs plots for the cavity scan with ETM08 surface map is also attached.
The codes are available at https://git.ligo.org/uc_riverside/hom-rh/-/tree/main/SIS |
| Attachment 1: IFOSim_SIS__update_4_8_24.pdf
|

|
| Attachment 2: Screen_Recording_2024-03-31_at_2.46.29_AM.mov
|
|
382
|
Mon Jun 24 21:38:25 2024 |
Pooyan | Infrastructure | Computers | Computer server changes in 1119 and 1129 |
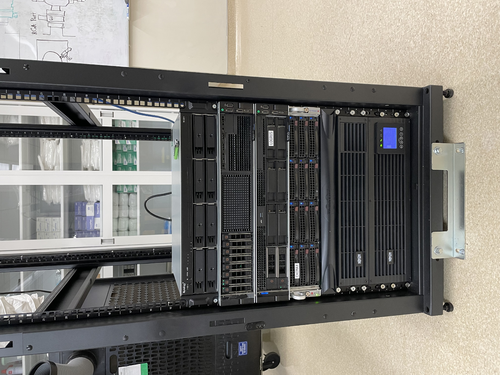
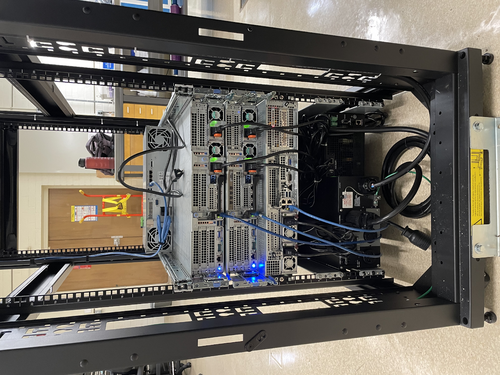
[Jon, Pooyan, Tyler]
A few computer machine changes have been made.
- Logrus moved from 1119 to 1129. It is up and running with the same IP address as before.
- A new Windows machine (host name: spica, IP:192.168.1.14) is installed in the 1119 server rack. It is connected to the RGA scanner with the serial port and is specifically used for that purpose.
- Update: The machine was off on 6/25, although it was left on 6/24. We think that it might have been because of Windows' default setting to suspend/hibernate the machine after idleness. To resolve this, I used "powercfg /change" command to set all the following parameters equal to zero. The machine is still running on 6/26.
    monitor-timeout-ac
    monitor-timeout-dc
    disk-timeout-ac
    disk-timeout-dc
    standby-timeout-ac
    standby-timeout-dc
    hibernate-timeout-ac
    hibernate-timeout-dc
-
A new Debian machine (hostname: megatron, IP:192.168.1.16) is installed in the 1129 server rack. This machine is intended to be used for FEA/simulation work. A new 2TB WD Green SSD is used as its main disk drive.
At the moment, “controls” is the only user, and there are no apps/libraries installed on the machine.
- Update: Jon installed LIGO cds-workstation tools and MiniConda on 6/26.
- Update: Pooyan and Liu set the following conda environments:
- Env named “finesse” with Python 3.12.3 and Finesse version 3.0a24 installed. Finesse was installed via the source code. The subdirectory “/home/controls/packages” is used to store the package sourcecodes.
- Env named “fenicsx” with the same version of Python and Finesse as the previous env, with the latest version of FEniCSx (0.8) and the test-mass-thermal-state installed.
|
| Attachment 1: IMG_6889.jpg
|
|
| Attachment 2: IMG_6890.jpg
|
|
|
406
|
Mon Jul 15 14:28:32 2024 |
Pooyan | Update | Interferometer Simulations | aLIGO test mass surface profiles |
Created a Google Slides presentation to summarize all the mirror surface map information that we use for simulating interferometers.
A+ expected maps are based on correspondence with G. Billingsley. The estimate for the A+ ITMs will be to take the “as polished” data and add coating non-uniformity to it. (T2000398) Neither of these are scaled for the precise thickness of the Ti:Ge coatings.
Google Slides link: https://docs.google.com/presentation/d/1ge-ciAiEdNyyTvSShYdZz2JpACFRY2W3JDpxHRqMnOQ/edit?usp=sharing
|
|
407
|
Mon Jul 15 14:49:06 2024 |
Pooyan | Update | Computers | Synology NAS server setup |
Installed a Synology NAS server (Synology RackStation RS1221) in lab room 1129, with host name “scribe” and ip “192.168.1.17”. It is mounted on the rack and each of its 8 storage bays has a 2TB SSD disk. It will be used to set up automated backups of all the lab machines (e.g., chimay, logrus, megatron).
One shared storage is set on it with SHR-2 as its RAID type. It can tolerate the failure of two disks and has 10.4TB of total capacity.
We can use both rsync and dd to create backups of the system. A suggested backup schedule could be daily rsync backups and bi-weekly disk snapshots using dd.
|
|
437
|
Mon Sep 9 14:27:36 2024 |
Pooyan | Infrastructure | Computers | Chimay backup attempt |
One ongoing work is to make all lab machines automatically backed-up on Scribe on a daily basis. The updates should be boatable and stored for some time (potentially a few weeks) on Scribe. Making whole disk images has already been tried for some of the machines with no problems. (e.g., Cymac and WorkStations)
The same thing can not be done with Chimay though, as it currently has one huge RAID-controlled volume that stores all the information (OS, home directories, and NDS-downloaded data). Creating daily full disk images of such a system is not practical.
Here is the plan we came up with to overcome this issue:
- Create one full disk image of Chimay and store it on Scribe (it was already done)
- Move the nds-downloaded raw data temporarily to Scribe and remove it from Chimay
- Make another full disk image of Chimay
- Burn this image to a single disk and boot chimay with it
-
Restore the rest of Chimay disks and move the NDS data back
On the weekend (Sat and Sun 9/7-8) I tried to execute these steps. There wasn't enough free space left on Scribe to move all the NDS data to it, so I stored part of this data temporarily on WS4. Then I also checked storage-consuming directories and, in one case, removed some non-important stored files. As there was no free space left on Scribe to execute step no. 3, I initiated storing the image on WS3. Unfortunately, a couple of different trials of the image-creation process failed as there was not enough free space on WS3 to accommodate Chiamy image as well. I was not able to reduce the image size such that it can be stored on WS3.
These are the options left for us to get this work done.
- Distribute the NDS files between different machines to make enough free space on Scribe for the image and then follow the previous plan
- Shrink the Chimay drive size, create the image and then follow the previous plan
- Temporarily transfer some services to Megatrone (Network gateway, Wiki, elog) and recreate chimay and its services from scratch
|
|
585
|
Tue Jun 3 11:50:08 2025 |
Pooyan | Update | CDS | CDS update |
There are three major issues with the lab's CDS system that should be addressed. They are ordered from the highest priority to the lowest.
- CyMAC has stopped serving the fast channels (65k Hz)
The channels are still there, and the data from the slow (16 Hz) channels is served correctly, but the fast data is not served. As a result, diagggui can not retrieve any information at the moment.
Probably the issue is the same as the version conflict between daqd and nds2-server. After installing nds2-server on CyMAC and realizing that the conflict can not be resolved, I reverted the changes so that the CyMAC could be compatible with daqd, but there is a chance that there are still version conflicts that block the fast channels.
I suspect that we have broken the MSC model when adding the new button. This could explain both the fasr-channels fault and the unexpected crashes.
UPDATE 6/5
Fixes this by rebuilding the models.
Note for the future: The c1iop and c1msc models should be rebuilt together, even if no change has been made to c1iop.
- The fast channels were not saved to the frames
Reviewing the frame files showed that the daqd was only saving the 16 Hz data in the .gwf frame files. I had missed this because I only checked the existence and the integrity of the raw frame files, but never retrieved the high-frequency data itself to check it.
- NDS2-server is installed, but does not distribute the data
I managed to install the nds2-server and its satellite programs on the Chimay, and NFS mount the frame files on it. The server successfully chaches the channel names, frame files, and the data, but fails to list the channels for distribution.
Note: CyMAC machine was strangely disconnected from the network, and required manual reboot. I couldn't find any abnormal logs that could explain what happened. |
|
590
|
Tue Jun 10 12:11:14 2025 |
Pooyan | Update | CDS | CDS update |
- The MEDM models issue was fixed. The issue was that building the c1msc model alone was not enough and we had to re-build the c1iop as well, although no changes has been made to the c1iop. Added a note in the wiki on this for future reference.
- For writing the fast channels to the frame files, our CDS system should have a GDS broadcaster. I followed this wiki page to set one, but it breaks the current daqd system. Asked about it earlier today on the CDS Mattermost channel and waiting for a response.
- Maybe I should continue the distributed scheme we have been trying for the nds2-server and let another machine on the network do this.
- Question: daqd has a feature to zero-out the bad data (NaNs), and it is currently on for our system. I don't think that it's a good idea to have this. Should I turn it off?
|
|
592
|
Wed Jun 11 16:19:37 2025 |
Pooyan | Update | CDS | CDS update |
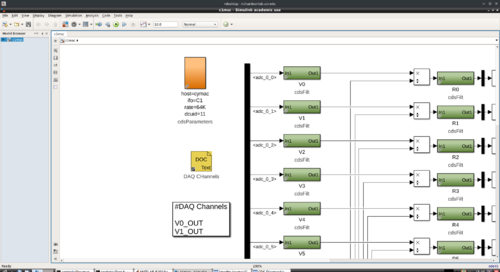
- Fast channels recorded to .gwf frame files
- The fast channels are recorded with an extra _DQ in their names. So, in ndscope and diaggui these two channels should be addressed as
- C1:MSC-V0_OUT_DQ
- C1:MSC-V1_OUT_DQ
-
Update 6/13: enabled recording of all the ADC voltage channels so that Tyler can use all the data for the noise floor calculation. attached is an example of diagggui with almost 30 hrs of data.
|
| Attachment 1: Screenshot_20250611_154834.png
|
|
| Attachment 2: f3k.pdf
|

|
|
593
|
Wed Jun 11 16:33:45 2025 |
Pooyan | Update | Computers | Luke's ray tracing hosting |
- Hosted Lukes model on Chimay. It's available at https://richardsonlab.ucr.edu/real-time-frosti
- The sourcecode is at Github. It is clones at
/var/www/html/real-time-frosti, and this is the block added to nginx config file at /etc/nginx/sites-available/default :
location /real-time-frosti {
root /var/www/html;
index index.html index.htm index.php;
}
- Also added this line to the crontab, so the code will be checked for updated from the sourcecode every five minutes.
*/5 * * * * cd /var/www/html/real-time-frosti/ && git pull
- TODO: Move the sourcecode from Github to git.ligo.org, and make the repository public.
|
|
632
|
Tue Aug 19 12:33:59 2025 |
Pooyan | Update | TCS | A# BS Update |
|
| Attachment 1: A#_beamsplitter_thermal_lensing.pdf
|

|
|
10
|
Wed Aug 17 16:04:30 2022 |
Phoebe Zyla | Summary | Lore | Testing the Cartridge Heater and Collecting FLIR Data |
We have tested the heater to find emissivity, mounted the heater system to the optical table, and have taken irradiance maps of the heater projected onto the screen.
The heater's emissivity was determined by using a thermocouple in conjunction with the FLIR's temperature calibration. To attach the thermocouple to the heater initially, I used Kapton tape and ran both the wires of the heater and the thermocouple through the heater bridge. This allowed for the heater to rest on an optical post and be observed without anyone directly holding it, but there were some measurement issues. The thermocouple had a very wide range of temperatures it was reading, which may have been due to intermittent contact or a short between the two legs of the thermocouple. To solve this and make the temperature measurements more stable, we pried apart the two ends of the thermocouple (to ensure there was no short) and put tape on either side, leaving the end connection bare. This was then taped to the heater, and the thermocouple was much more stable. We also used a K-type thermocouple that has an adhesive tape on it already, which assisted with the intermittent contact as well. With the thermocouple measuring the temperature of the heater, we could point the FLIR directly at the heater and calibrate the emissivity until the FLIR and the thermocouple agreed. Cassidy's emissivity calculator was also used, as I could input a temperature and observe what the emissivity of an area was based on that temperature. We found the emissivity of the heater to be 0.57.
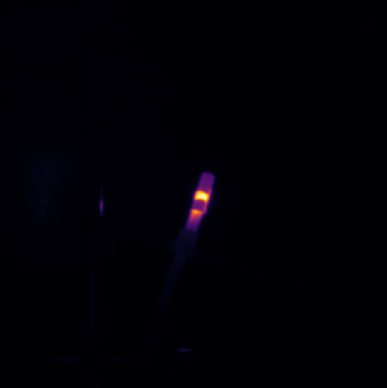
As a note, when observing the heater with the FLIR, it appeared that there was a hot spot in the center, where the Kapton tape sat. Because the Kapton has a different emissivity than the 304 stainless steel of the heater, the FLIR will read it as having a different temperature than it actually does. When using the FLIR in the future, be sure to ascertain whether there is a temperature difference somewhere or if there may be different emissivities.
Additionally, the first heater that I used was taken to a very high temperature and oxidized. The emissivity of this oxidized heater is not known, but could be good information for knowing how oxidation affects these heaters specifically.
To mount the heater system in front of the screen, I used 1/2'' optical posts and the mount I designed using COMSOL's CAD program. The heater was originally 2.5 inches away from the screen, and has since been moved back by an additional two inches so that we could observe the heater side of the screen with the FLIR. We wanted to see what temperature the heater side of the screen was when irradiated by the heater, and how that compared to the camera side of the screen. When the heater ran at 1.12 W of input power, the heater side of the screen had a max temperature of around 29.7 C, and the camera side of the screen read at about 29.5 C. This means that there is very little thermal loss between the two sides of the screen, and any insulation that the screen's adhesive may have is largely negligible. Additionally, the camera was placed at an angle and undetermined distance for these tests, confirming that the temperature measurements compensate well/don’t depend on changes in angle or distance between the camera and the screen. However, there was spots on the back of the screen that the camera was measuring as hot spots where there shouldn’t have been any. I have included an example below. It would be useful to run a test where the camera is directly on the back of the screen without the heater to characterize the screen and see if the hot spots are physically present on the screen or if this is an artifice of the camera because of something like angle of viewing.
Taking irradiance maps of the screen was straightforward. After checking that the emissivity of the screen is 0.99 by viewing it at room temperature, we monitored the max temperature while slowing increasing the wattage the heater was running at. There is not a large change until the heater is at around 95 C, at which point the screen began to rise in temperature from 27 C to 28 C. We took measurements of this while the heater was 2.5 and 4.5 inches away from the screen. The irradiance map has a very symmetrical and circular shape, but does not have the ring pattern that we expected. There may be a few reasons for this: there could be some conduction between the two sides of the screen that is causing the pattern to spread further, the heater setup may not be as ideal as it was modeled to be, or there could be a different, unknown issue.
TO DO:
- It would be useful to run a test of the camera in multiple different positions to ensure our conclusion that the camera’s measurements don’t depend on angle or distance (or that these factors are well accounted for in the current temperature calculations) is correct.
- Measure the back of the screen straight on to identify bright spots and possible reasons as to their appearance.
- Recalibrate camera to ensure it is still correct after testing in multiple positions.
- Take another irradiance map of the screen at a higher input power, as well as moving the heater close/further away to try and replicate the COMSOL irradiance maps. It would be useful to also redo the COMSOL modeling at lower powers and variable distances.
Pictures included of full table setup, the heater mount, the heater with Kapton tape attaching the thermocouple as well as FLIR's measured irradiance map. |
| Attachment 1: Screenshot_(74).png
|
.png.png)
|
| Attachment 2: Screenshot_(75).png
|
.png.png)
|
| Attachment 3: Screenshot_from_2022-08-15_11-24-40.png
|
|
| Attachment 4: AcquisitionImage(Aug-15-2022_14_16).jpg
|
.jpg.png)
|
|
8
|
Fri Jul 22 13:20:28 2022 |
Phoebe | Update | | Comsol |
| I will be using comsol until 1:30 pm today. I will be updating the model for the heater mount to be thicker in certain areas, so that it can feasibly be 3D printed. Specifically, the radius of the center cartridge mount has been increased to add thickness to the pipe and the arms of the bridge. This will allow us to print with a much smaller chance for error, as the printer can print objects with a minimum length of 1 mm. |
|
16
|
Mon Jan 23 17:26:15 2023 |
Peter Carney | Update | General | Oven cleaning |
| Aiden and Cao
Turned on the oven to 120 deg C for 12 hours. After 12 hours, put it at 200 deg C for 48 hours. |
|
21
|
Sat Feb 4 17:01:03 2023 |
Peter | Update | VLC Electronics | Laser Data |
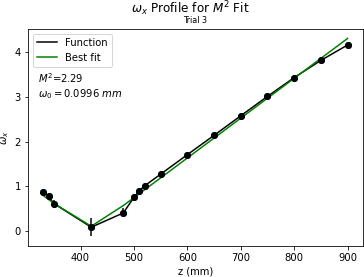
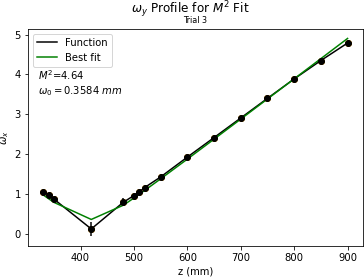
| Peter and Ryan took laser beam data. Configuration: 100mm focal length lens is ~100mm from lens. 150mm focal length lens is ~200mm from first lens. Beam waist is ~420mm from second lens.
Beam waist is very small still. Had to input large amounts of error in data collection. Took width data successively at points near waist and at >= Rayleigh range. Plots are shown below.
Key points:
Took a while to figure out optimum configuration for lenses to be placed so that an accessible beam waist could be obtained.
Beam waist is still very small. May need to do an ABCD calculation to see if there is anything bigger that can be obtained. |
| Attachment 1: OmegaX_M2_Fit_3.png
|
|
| Attachment 2: OmegaY_M2_Fit_3.png
|
|
|
36
|
Tue Feb 28 19:31:05 2023 |
Peter | Update | VLC Electronics | 532 M2 Measurements |
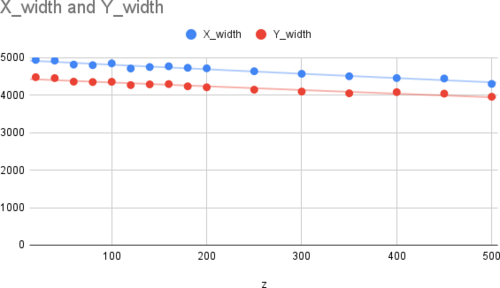
| Took M2 measurements today. Configuration: Lens 1 (f = 50mm) at 0mm. Lens 2 (f = 150mm) at 200mm, camera at 350mm. The laser beam was being moved in -z direction on track (so further away from the first lens). Quick data shown in the sheets plot. Not a real fit. I was trying to see where the beam waist was if there even was one. Seems that it is much further than we have room for on the track. Will need to come back and take more data.
I suggest maybe Dr. Richardson or Cao come and see the configuration in person and how the beam diverges for themselves on the detector card. Maybe they can offer pointers to make this go smoother. |
| Attachment 1: X_width_and_Y_width.png
|
|
|
37
|
Tue Feb 28 19:33:51 2023 |
Peter | Update | | 532 M2 Measurements |
| Y axis of plot in units of micrometers. X axis in units of millimeters. |
|
48
|
Thu Mar 9 12:03:59 2023 |
Peter | Update | VLC Electronics | 532 M2 Measurements |
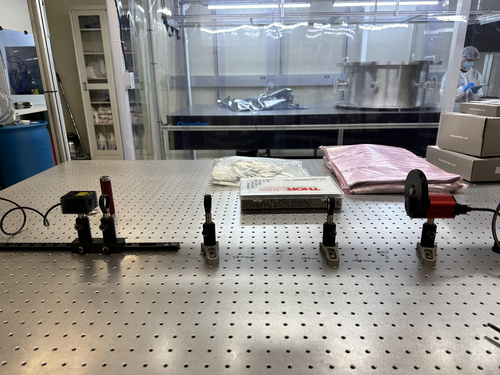
| Took more M2 Data today. Picture of the optical set up is shown below. lens1 f = 100mm, lens2 f = 50mm, lens3 f = 150mm. There was a nice converging/diverging beam profile, and the beam waist was able to be read by the camera. I took as much data as I could before clipping loss. The M2 value is quite high. |
| Attachment 1: OmegaY_M2_Fit_3.png
|

|
| Attachment 2: OmegaX_M2_Fit_3.png
|

|
| Attachment 3: optical_setup.jpg
|
|
|
50
|
Fri Mar 10 12:08:09 2023 |
Peter | Update | VLC Electronics | 532 M2 Measurements |
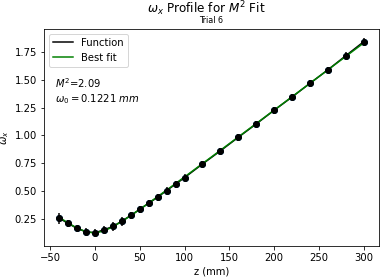
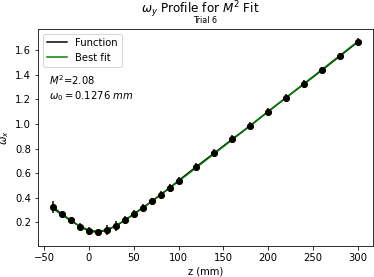
| Took more M2 laser data today. The configuration is the same as before except now the beam camera is the only component moving. Pictures can be seen below. The beam shape in x and y is very consistent with low error. However, the M2 value is still a bit high. |
| Attachment 1: OmegaX_M2_Fit_4.png
|
|
| Attachment 2: OmegaY_M2_Fit_4.png
|
|
|
61
|
Tue Apr 4 09:39:58 2023 |
Peter | Update | VLC Electronics | 532 M2 Measurements |
| Final M squared measurements were taken Wednesday, 3/29/23 by Peter and Ryan Hinosawa. 5 separate sets of data were taken, and upon discussion, we declared the plots shown below in attachment 1 and 2 as the final plots of our M squared measurements.
The optical design of the M squared measurement process is given in attachment 3. The laser and three lenses shown below are mounted on the optical table. The track is placed behind the third lens, and the camera is moved along the track to take successive measurements of the beam's width. This will allow us to see a change in the beam's width over its propagation direction.
The raw data is given in attachment 4 as a Beam_Data_8_3lens.txt file. This is eventually what gets used to generate the plots shown below.
The code to run the analysis on these measurements (as well as analysis on the Gaussian intensity profile fitting) can be found:
git@git.ligo.org:uc_riverside/visible-light-cavity.git |
| Attachment 1: OmegaY_M2_Fit_8.pdf
|

|
| Attachment 2: OmegaX_M2_Fit_8.pdf
|

|
| Attachment 3: M2_Measurements_Set_Up.svg
|

|
| Attachment 4: Beam_Data_8_3lens.txt
|
z-z0	x_width	y_width	x_error	y_error
-50	267	304	30	30
-40	227	261	30	30
-30	192	223	30	30
-20	167	194	30	30
-10	153	169	50	50
0	149	154	50	50
10	166	152	50	50
20	198	169	50	50
30	233	195	50	50
... 17 more lines ...
|
|
62
|
Tue Apr 4 09:53:37 2023 |
Peter | Update | VLC Update | Laser intensity/polarization drift measurements |
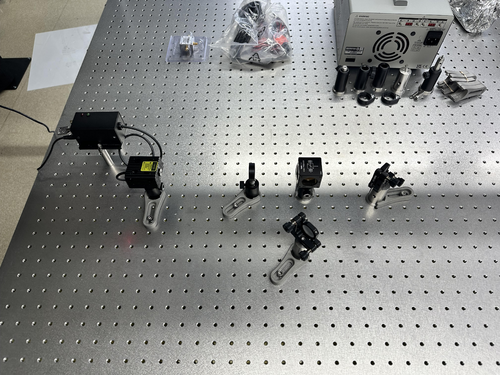
| The set up for the next round of beam characterization measurements has begun. The beam is initially passing through a half waveplate, is split at a polarizing beam splitter, and then stirring mirrors are used to properly aim the beam into photodiodes (not yet installed). This is the current configuration of the set up. |
| Attachment 1: initial_Intens_measure_set_up.jpg
|
|
|
65
|
Thu Apr 6 10:20:43 2023 |
Peter | Update | VLC Update | Laser intensity/polarization drift measurements |
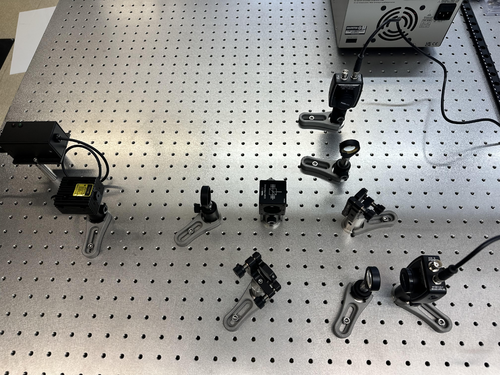
| More optical components were added to the optical set up for laser intensity / polarization drift measurements. Both lenses and both PDs were added to the configuration, as seen in the image below. The beam is already well aligned into the center of both of PDs, and focused nicely by the lens.
Both PD's take BNC connecting cables, and the Red Pitaya takes SMA connecting cables. Since we are currently without a BNC to SMA cable, and we do not want to cut, strip, and crimp what we have, then measurement process cannot proceed until we get the cables. |
| Attachment 1: Optical_Setup_4-6-23.jpg
|
|
|
83
|
Fri Apr 28 11:21:01 2023 |
Peter | Update | VLC Update | Laser intensity/polarization drift measurements |
| The Digi-key cables have arrived, and I have began implementing them in the intensity drift measurements.
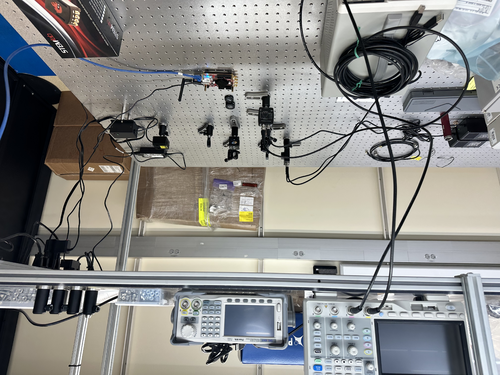
There was a slight problem initially in connecting the SMA to BNC cables from the photodiode to the red pitaya, since the red pitaya was way on the other side of the lab. Cao and I connected the red pitaya to a new ethernet cable that extended far enough for the red pitaya to sit comfortably on the breadboard with the optics.
Right now the PDAs are not connected to the red pitaya. I have connected them to the oscilloscope in order to read out how much voltage they produce upon incidence of 532nm laser light. This was done in order to make sure that they do not surpass the limit of the red pitaya (+-1V). I have not acquired a value for the readout voltage of the PDAs since I had to go to class. I will gather this preliminary data soon. |
| Attachment 1: IMG-0183.jpg
|
|
|
88
|
Mon May 1 18:56:57 2023 |
Peter | Update | VLC Electronics | 532nm Intensity Measurement |
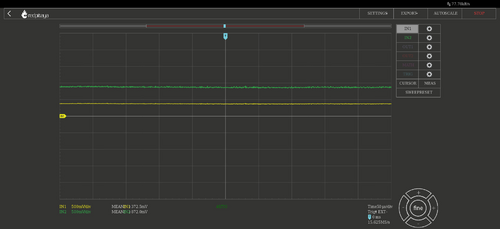
| I've configured the two PDA's to the Red Pitaya. I put a 50 ohm resistor connector to each red pitaya input port. This was because the oscilloscope showed that the voltage reading from the P polarization PDA was almost at 1V, which was the limit of the red pitaya. Once both S and P polarization PDA's were connected, I opened the red pitaya's oscilloscope. A screenshot of the voltage readings is shared below. Channel 1 (Yellow) is for S polarization. Channel 2 (Green) is for P polarization. It would seem that there is a significant amount of polarization in the P direction as opposed to the S direction.
I then tried running the template time series measurement within the python notebook from channel 1 only. The python notebook graph is shown below. I have not figured out what are the units of time on the x axis, and I have not figured out how to change the amount of time that the red pitaya takes data. A plot of the time series measurement is shown below. |
| Attachment 1: graphs.jpg
|
|
| Attachment 2: Time_Series_Trial_1.png
|
|
|
89
|
Tue May 2 15:55:33 2023 |
Peter | Update | VLC Electronics | 532nm Intensity Measurement |
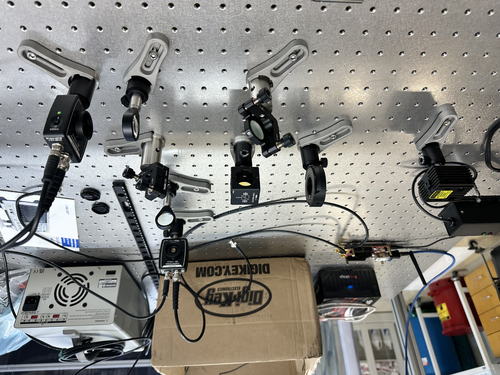
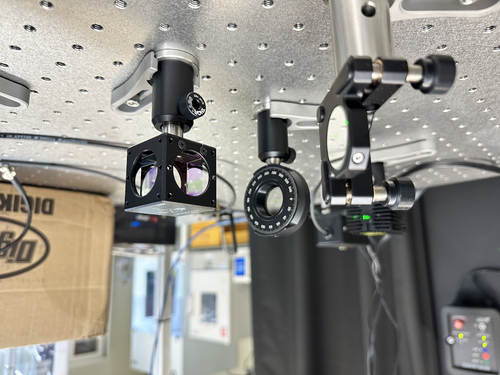
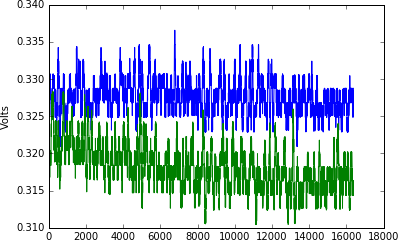
| I changed the 1/2 wave plate from the lens mount to the rotational optic mount. This allowed me to rotate the 1/2 wave plate, which changed the respective polarization power transmitting through S and P polarization. Initially, more power was coupled into the P polarization. Now, with the 1/2 plate rotated, both channels are experiencing the same voltage reading. Before feeding the PDA signals into the red pitaya, a 50 ohm terminator had to be placed at the SMA connection port so that the input power into the red pitaya did not exceed 1V. With this configuration, both channels experience about 0.35mV. (See attached)
I then opened the Jupyter notebook, and ran a demo time series measurement from the red pitaya. This time, I was able to get a plot featuring both channels (green is P polarization. Blue is S polarization). The plots are consistent with what is shown in the red pitaya oscilloscope. However, the time collection (I'm assuming) only runs for about 0.018s. I will have to write some of my own code to loop over this measurement, and collect more data. |
| Attachment 1: IMG-0221.jpg
|
|
| Attachment 2: IMG-0222.jpg
|
|
| Attachment 3: graphs(1).jpg
|
.jpg.png)
|
| Attachment 4: Time_Series_Trial_2.png
|
|
|
92
|
Thu May 4 14:01:10 2023 |
Peter | Update | VLC Electronics | 532nm Intensity Measurement |
| I adjusted the rotational mount of the wave plate to see if the power can be 100% coupled into either S or P polarization. The images shown below of the oscilloscope indicate that this is not possible. The minimum transmitted power we can obtain in either S or P polarization is 75mV. The maximum voltage we obtain in either S or P polarization is ~ 740mV. This means that at a maximum, we can obtain ~ 90% polarization in either direction, indicating that our laser has a slightly elliptical polarization. |
| Attachment 1: graphs(3).jpg
|
.jpg.png)
|
| Attachment 2: graphs(2).jpg
|
.jpg.png)
|
|
99
|
Tue May 16 11:56:33 2023 |
Peter | Update | VLC Electronics | 532nm Intensity Measurement |
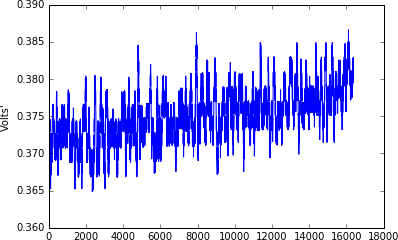
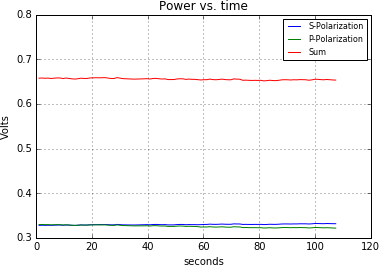
| With the configuration the exact same as before, I used the Jupyter notebook in the red pitaya's development package to collect data from both input channels. Last week, I was able to take data, yet only for a very short period of time, and I did not know how to change it. I went online to the red pitaya's user manual to figure out how to change the sampling period for longer. The link to the page is here: https://redpitaya.readthedocs.io/en/latest/appsFeatures/examples/acqRF-samp-and-dec.html#s-rate-and-dec Though I now know how to change the period of time for which data is taken, the maximum amount of time is still only about 8 seconds. So with help from Cao, we looped over the data taking samples, and got a mean value for each iteration. We then put all those mean values in an array, and plotted it. Below, we see a plot of both the S and P polarizations, and a sum of both of them. As seen in the graph, I have set the time to be able to take data for almost 2 minutes. There is some slight drift in the respective intensities. The next steps I believe are to convert the units into watts, and take data for longer periods of time. |
| Attachment 1: Time_Series_Trial_3.png
|
|
|
101
|
Thu May 18 14:07:08 2023 |
Peter | Update | VLC Update | 532nm Intensity Measurement |
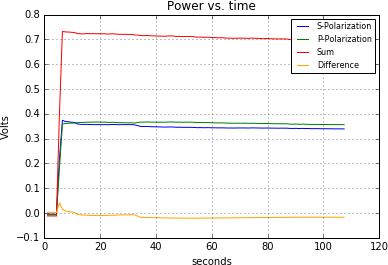
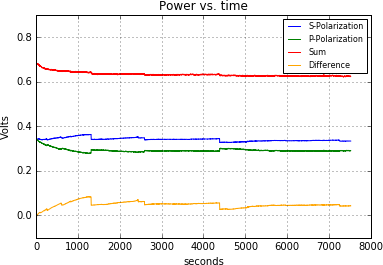
| I figured out a method in which to capture power measurements including the initial seconds in which the beam is first turned on. I first clear and restart the kernel of the python notebook. Then I run the command to connect the red pitaya oscilloscope package to the input data being taken in both channels. To my understanding, this allows for data acquisition as the code compiles. I then started looping the 1.074s trigger bunches, and then roughly 2 seconds after I ran that command, I went and turned on the laser. The first plot shown is a 2 minute practice trial of me trying this technique to make sure that the python package was correctly registering the input of the red pitaya. It is clear that initially the laser is off, and then as I turned it on, the voltage in each channel spikes, which is compelling evidence that the code is working. I then set the data collection to be 7518 seconds (7000 loops), which is about 2 hours and 5 minutes. I repeated the same technique as for the first plot, only changing the amount of time I collected data. The second plot shown here is the voltage being read in each channel as a function of time. As we can see, over a period of hours, the intensity drifts quite dramatically for the first several minutes, and then begins to stabilize slightly. However, there are still some strong sudden fluctuations in each channel. |
| Attachment 1: Time_Series_Trial_4.png
|
|
| Attachment 2: Time_Series_Trial_5_2hrs.png
|
|
|
102
|
Mon May 22 16:43:28 2023 |
Peter | Update | VLC Electronics | Laser intensity/polarization drift measurements |
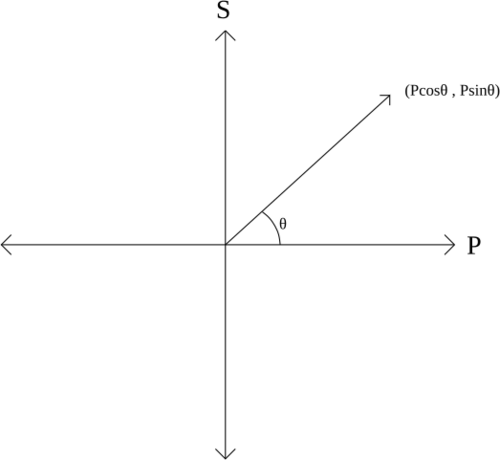
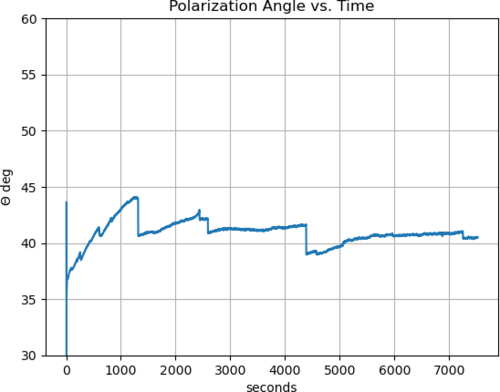
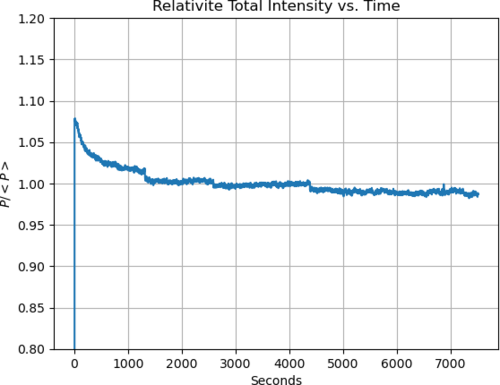
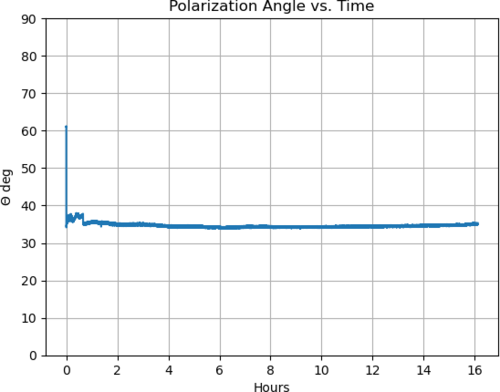
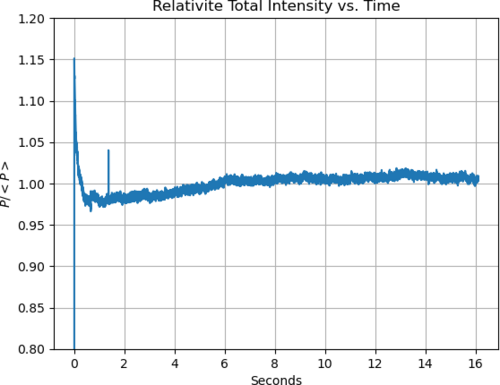
| In order to fully analyze the polarization data taken last Thursday, I needed to convert the signal output (which is in volts) to power (units of watts). I used the power meter to accomplish this. Keeping the exact same configuration of PD's and beam splitting, opened the red pitaya's oscilloscope package. I then took the power meter, and held it in front of the PD to measure the amount of Watts at each PD. I then wrote down the corresponding voltage being seen in the red pitaya. I took 5 sets of measurements for each PD to get experimental accuracy. I then used a simple y = mx + b fit to find out the constant m that converts the input wattage into voltage. For the s polarization, the conversion factor is 0.83. For the p polarization, the conversion factor is 1.12. I then used this data to plot polarization angle as a function of time, and the relative intensity drift as a function of time. The plots are shown below. The physical meaning of the polarization angle is shown in the unit circle diagram below, in which P is the total power. |
| Attachment 1: S-P_Polarization_Diagram.svg
|
|
| Attachment 2: Polar_angle_vs_time.png
|
|
| Attachment 3: Rel_Intens_vs_time.png
|
|
|
107
|
Wed May 24 14:28:26 2023 |
Peter | Update | VLC Electronics | Laser intensity/polarization drift measurements |
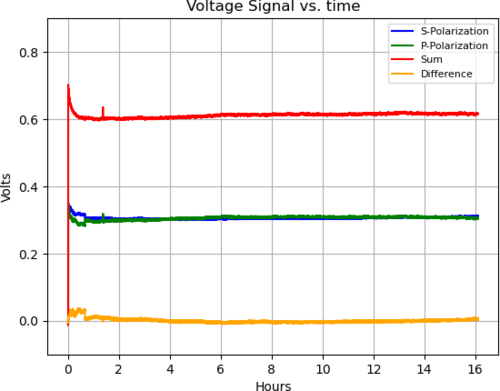
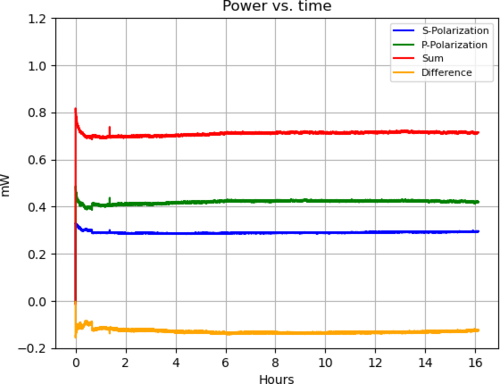
| I went in and took polarization drift data for 16 hours. The run started at 6:08pm and finished at 9:15am the next day. The four plots below are the same plots shown for the 2 hour collection and previous trials, except they extend to 16 hours. The only one that is different is the Power vs. Time graph. This is a graph of the actual incoming power of the laser (as opposed to the signal voltage that the PDA's output into the red pitaya). This was done using the calibration factors of the respective PDA's and as we can see, since there is a difference in the calibration factors between detectors, there is a difference in the power that's coupled into S and P polarization. |
| Attachment 1: Time_Series_Trial_7_16hrs.png
|
|
| Attachment 2: Power_vs_Time_16hrs.png
|
|
| Attachment 3: Polar_angle_vs_time_16hrs.png
|
|
| Attachment 4: Rel_Intens_vs_time_16hrs.png
|
|
|
116
|
Tue Jun 6 16:15:09 2023 |
Peter | Update | VLC Update | Launch Optics for Visible Light Cavity |
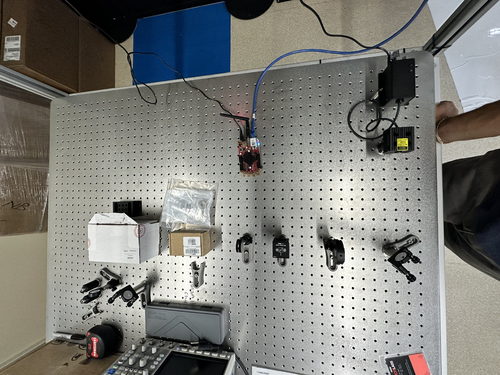
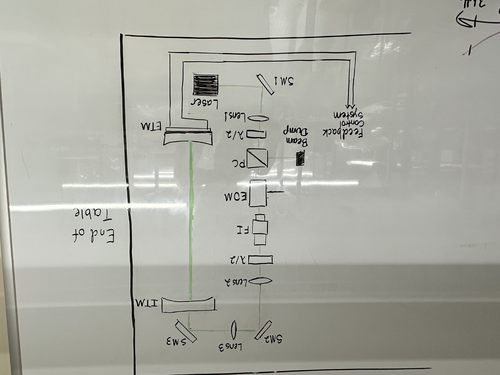
| I assembled the first few components of the launch optics for the visible light cavity. Below is an image of the current table configuration, and the image is how the cavity will be oriented on the table. |
| Attachment 1: IMG-0882.jpg
|
|
| Attachment 2: IMG-0883.jpg
|
|
|
221
|
Thu Sep 7 19:24:25 2023 |
Peter | Update | VLC Update | VLC Launch Chain |
| The launch optics up to the Faraday Isolator have been added to the breadboard. In the first image, the optics are (from L to R) the stirring mirror, half-wave plate, polarizing cube, 100mm f lens, electro-optical modulator, Faraday isolator, 50mm lens (not part of final design), stirring mirror (not part of final design) |
| Attachment 1: IMG-3404(1).jpg
|
.jpg.png)
|
| Attachment 2: IMG-3408(1).jpg
|
.jpg.png)
|
|
234
|
Mon Oct 9 11:06:17 2023 |
Peter | Update | VLC Update | VLC Launch Chain |
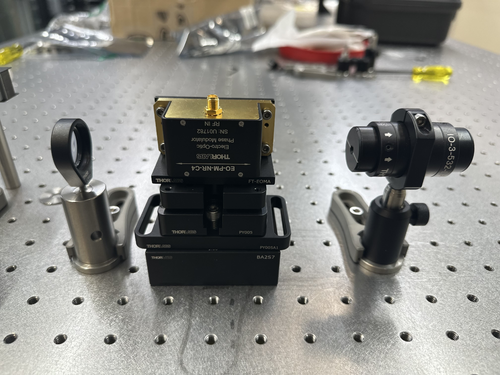
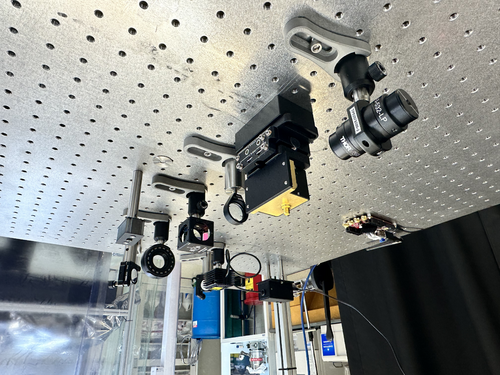
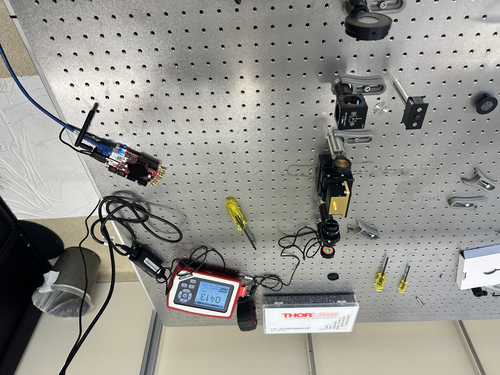
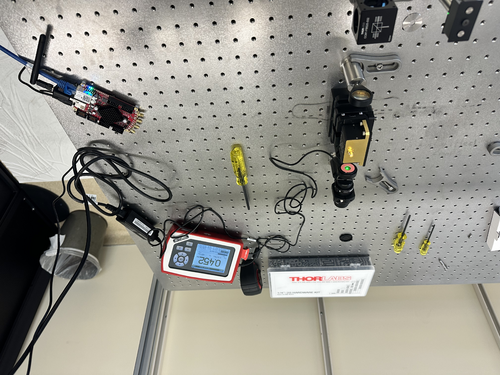
| Implemented the new stage for the EOM. Took power data at different positions in the launch chain. Beam waist: 0.066mm (beam waist is inside EOM). Power before EOM: 0.473mW. Power after EOM: 0.452mW. Power after Faraday Isolator: 0.415mW. Might need to adjust better to configure for clipping losses. Images of setup are attached below. |
| Attachment 1: IMG-3540.jpg
|
|
| Attachment 2: IMG-3538.jpg
|
|
| Attachment 3: IMG-3533.jpg
|
|
| Attachment 4: IMG-3522.jpg
|
|
|
242
|
Mon Oct 23 07:28:57 2023 |
Peter | Update | VLC Update | VLC Mode Matching |
| I have attached a pdf with slides of my latest updates. |
| Attachment 1: Carney_VLC_Update.pdf
|

|
|
256
|
Mon Nov 6 11:31:25 2023 |
Peter | Update | VLC Update | VLC Mode Matching |
| See Update Attached |
| Attachment 1: VLC_Update_11_6_23.pdf
|

|
|
263
|
Mon Nov 13 06:15:45 2023 |
Peter | Update | VLC Update | VLC Mode Matching |
| Weekly Updates Attached in pdf |
| Attachment 1: VLC_Mode_Matching_3.pdf
|

|
|
288
|
Fri Dec 8 11:15:21 2023 |
Peter | Update | VLC Update | VLC Assembly |
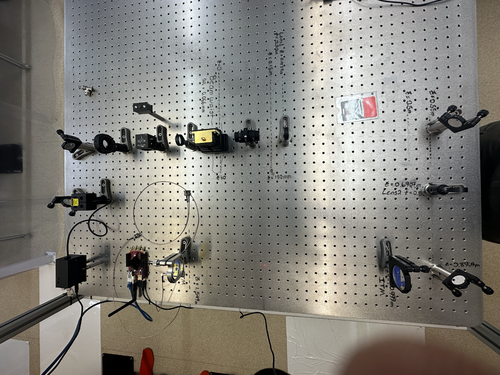
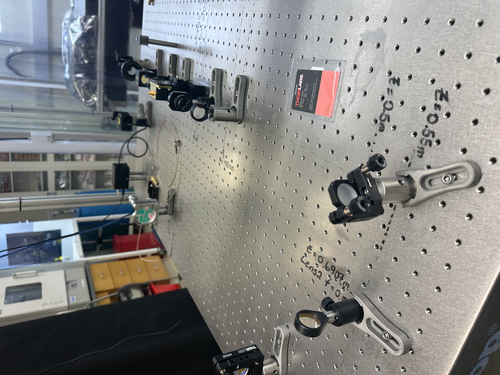
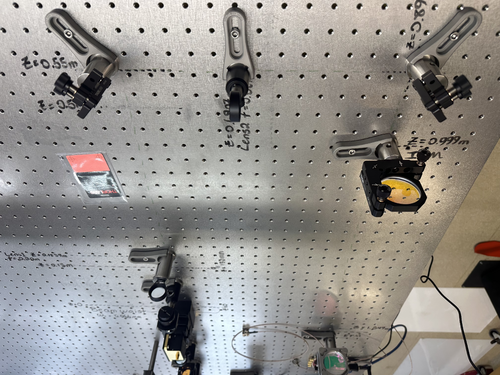
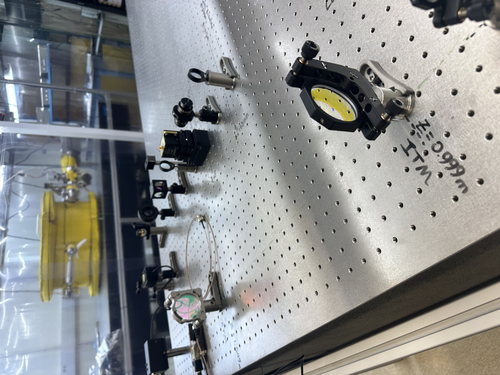
| The optics of the visible light cavity have been assembled. The mode matching telescope is folded through the two stirring mirrors at the corners shown in the image below, with the first lens (f=0.2m) before the first stirring mirror, and the second lens (f=0.5m) between the two stirring mirrors. The distance from the cavity to the edge of the table is 14cm. There is still some work to be done on the alignment of the cavity, as the beam does not seem to be completely centered on the two mirrors. |
| Attachment 1: IMG_4194.jpg
|
|
| Attachment 2: IMG_4195.jpg
|
|
| Attachment 3: IMG_4197.jpg
|
|
| Attachment 4: IMG_4196.jpg
|
|
|
304
|
Tue Jan 16 10:01:21 2024 |
Peter | Update | VLC Update | VLC Faraday Isolator and Mode Matching |
| Attached is a PDF of my weekly updates. |
| Attachment 1: VLC_Mode_Matching_Design_-_Remastered.pdf
|

|
|
321
|
Tue Feb 13 01:26:30 2024 |
Peter | Update | Interferometer Simulations | CARM Power Simulations |
| Cao's simulations of the circulating power and gouy phase through a single arm cavity of the interferometer have been reproduced. Images of the plots can be shown in the pdfs attached. There are approx. 400 lines in this code (scenario_3_carm) that produces these plots. This code also calls on a separate code source file (thermal_models) that defines many of the functions used in this main simulation. The thermal_models file consists of over 1000 lines. More work needs to be done to fully understand and document the scripts. |
| Attachment 1: Scenario_3_CARM.pdf
|

|
| Attachment 2: Scenario_3_CARM_Gouy.pdf
|

|
|
360
|
Mon Apr 15 11:51:03 2024 |
Peter | Update | VLC Update | VLC |
| An update on the VLC project is attached below: |
| Attachment 1: VLC_Update_April_15_2024.pdf
|

|
|
368
|
Mon May 13 14:53:29 2024 |
Peter | Update | VLC Update | VLC |
| VLC Update WEEK 7 attached below |
| Attachment 1: VLC_Update.pdf
|

|
|
147
|
Thu Jul 6 13:34:48 2023 |
Pamella, Shane, Julian, Aiden | Update | Cleanroom | cleaning and particle count |
|
[Pamella, Julian, Aiden, and Shane]
|
|
93
|
Mon May 8 12:00:03 2023 |
Pamella, Shane, Julian | Update | General | Cleanroom particle counts and cleaning the cleanroom. |
[Pamella,Julian, Shane]
Today we cleaned the clean-room (floor, surfaces) and particle count.
10:00 am: Started particle count.
- Zone 3:
- 0.3u: 1330
- 0.5u: 540
- 1.0u: 415
- Zone 4:
- 0.3u: 290
- 0.5u: 83
- 1.0u: 0
Clean-room:
- 10:30 am: Started wiping down the surfaces inside the clean-room
- 10:41 am: Finished wiping down the surfaces inside the clean-room and Started vacuuming the clean-room.
- 10:58 am: Finished vacuuming the clean-room.
- 11:00 am: Started mopping on the floor.
- 11:20 am: Finished mopping on the floor and started wiping on the floor.
- 11:34 am: Finished wiping on the floor.
- 11:35 am: Started the particle count.
- 11:57 am: Finished the particle count.
- Zone 3
- 0.3u: 997
- 0.5u: 290
- 1.0u: 207
- Zone 4
- 0.3u: 374
- 0.5u: 207
- 1.0u: 207
|
|
166
|
Wed Jul 19 14:39:19 2023 |
Pamella, Shane, Aiden | Update | Cleanroom | cleaning and particle count |
|
[Pamella, Shane, Aiden]
cleaning cleanroom and particle count
- 1:10 pm: started particle count
- 1:30 pm: began surface check and wipedown
- 1:41 pm: started vacuuming the floor
- 1:55 pm: finished vacuuming the floor
- 1:57 pm: started mopping the floor
- 2:01 pm: finished mopping the floor
- 2:02 pm: started cleaning the buckets
- 2:08 pm: started mopping with IPA wipes
- 2:17 pm: finished mopping with IPA wipes
- 2:18 pm: changed sticky floor mats
- 2:19 pm: started particle count
|
|
79
|
Wed Apr 26 18:05:41 2023 |
Pamella, Julian, Shane | Update | Cleanroom | cleanroom particle counts and cleaning log |
- pre-cleaning particle counts:
- zone 3
- 0.3 mu: 2494
- 0.5 mu: 748
- 1.0 mu 124
- zone 4
- 0.3 mu: 374
- 0.5 mu: 41
- 1.0 mu: 0
- 3:45 pm: Started wiping the surfaces(laser table,chamber, computer) inside the cleaning room.
- 4:05 pm: Finished wiped the surfaces
- 4:08 pm: Began vacuuming cleanroom floor
- 4:28 pm: Finished vacuuming cleanroom floor.
- 4:29 pm: Began mopping the cleanroom floor.
- 5:15 pm: Finished cleanroom clean.
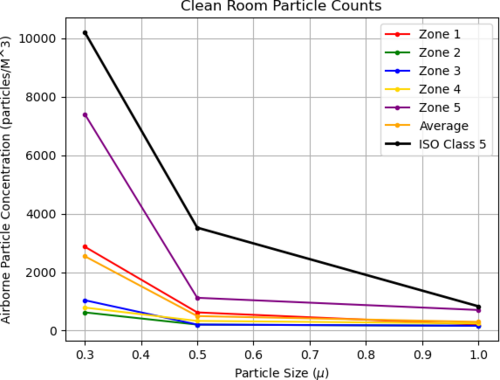
- 6:00 pm: post-cleaning particle counts (full 5 zone measurement) attached below
|
| Attachment 1: counts4_26_23.png
|
|
|
100
|
Wed May 17 12:18:08 2023 |
Pamella, Julian and Shane | Update | General | Cleaning room and particle count |
[Pamella, Julian and Shane]
Particle count:
- 10 am: Started particle count
- Zone 3 :
- 0.3u: 1288
- 0.5u: 332
- 1.0u: 124
- Zone 4 :
- 0.3u: 498
- 0.5u: 166
- 1.0u: 83
- 10:40 am: Checked the surfaces inside the cleanroom.
- 10:50 am: Started vacuuming the cleanroom.
- 11:15 am: Started mopping the cleanroom.
- 11:35 am: Started wiping the cleanroom floor.
- 11:40 am: Finished cleaning the cleanroom.
- 11:41 am: Started the particle count.
- 12:17 am: Finished the particle count.
- Zone 3 :
- 0.3u: 3782
- 0.5u: 706
- 1.0u: 207
- Zone 4 :
- 0.3u: 374
- 0.5u: 83
- 1.0u: 83
|
|
109
|
Wed May 31 11:42:16 2023 |
Pamella, Julian and Shane | Update | General | Cleaning room and particle count |
[Pamella, Shane and Julian]
Cleaning room and particle count
- 09:58 am: Started the particle count
- Zone 3:
- 0.3u : 1,995
- 0.5u : 540
- 1.0u : 0
- Zone 4:
- 0.3u : 124
- 0.5u : 0
- 1.0u : 0
- 10:25 am: Started checking the surfaces inside the cleanroom.
- 10:30 am: Started vacuuming the floor.
- 10:45 am: Finished vacuuming the floor.
- 10:46 am: Started mopping the floor.
- 10:58 am: Finished mopping the floor.
- 11:00 am: Started wiping floor with polypropylene wipes.
- 11:03 am: Started and finished cleaning the mop buckets.
- 11:15 am: Finished wiping floor with polypropylene wipes.
- 11:16 am: Changed sticky floor mats.
- 11:20 am: Started the particle count.
- Zone 3:
- 0.3u : 2,951
- 0.5u : 872
- 1.0u : 207
- Zone 4:
- 0.3u : 374
- 0.5u : 83
- 1.0u : 0
|
|
131
|
Thu Jun 22 13:58:00 2023 |
Pamella, Julian and Shane | Update | Cleanroom | Cleaning and Particle Count |
[Pamella, Shane, and Julian]
cleaning cleanroom and particle count
-
12:00 pm: started particle count
- Zone 3
- 0.3u: 3533
- 0.5u: 540
- 1.0u: 166
- Zone 4
- 0.3u: 290
- 0.5u: 124
- 1.0u: 41
12:31 pm: Started checking the surface inside the cleanroom and began surface wipedown
12:50 pm: started vacuuming the floor
1:05 pm: Finished vacuuming floor
1:09 pm: Started mopping the floor
1:21 pm: Finished mopping the floor
1:22 pm: Started cleaning the baskets
1:25 pm: Started mopping with IPA wipes
1:39 pm: Finished mopping with IPA wipes
1:41 pm: Changed sticky floor mats
1:45 pm: Started particle count
- Zone 3
- 0.3u: 2327
- 0.5u: 581
- 1.0u: 207
Zone 4
- 0.3u: 1662
- 0.5u: 374
- 1.0u: 290
|
|
129
|
Tue Jun 20 22:14:24 2023 |
Pamella, Cao | Infrastructure | VAC | Short term testing of vacuum heater controller units |
| [Pamella, Cao]
Fuse replacement
- Replace blown 10A fuse in ucontroller outside cleanroom
- Replace 10 A fuse in main power connection slot of the controller unit inside cleanroom
- Pamella wiped down unit outside cleanroom.
- Controller units turned on and temperature setpoint set to be 80 deg C
- Temperature settle in approx. 15 minutes(as recorded by the RTD). No problems with fuses observed
- Recording of pressure gauges (in Torr) :
- Before turning heater on :
- Gauge 1(main chamber): 3.73E-7
- Gauge 2(RGA line): 3.65E-7
- Gauge 3(Pump line): 3.8E-4
- After 15 minutes :
- Gauge 1(main chamber): 7.07E-7
- Gauge 2(RGA line): 6.12E-7
- Gauge 3(Pump line): 3.8E-4
- Reduce setpoint temperature to 60 deg C due to Pinrani gauge (Gauge 3) temperature limit
- Upon returned to lab to reduce temperature (35 minutes after turned on):
- Gauge 1(main chamber): 1.22E-6
- Gauge 2(RGA line): 9.98E-7
- Gauge 3(Pump line): 3.8E-4
- Once temperature has settled to 60 C (approx 20 mins after changing setpoint), pressure readout showed:
- Gauge 1(main chamber): 1.37E-6
- Gauge 2(RGA line): 1.10E-6
- Gauge 3(Pump line): 3.8E-4
- Heater left on for the whole afternoon, pressure readout upon returning to lab at 5:30 pm:
- Gauge 1(main chamber): 3.43E-6
- Gauge 2(RGA line): 2.61E-6
- Gauge 3(Pump line): 3.8E-4
|