| ID |
Date |
Author |
Type |
Category |
Subject |
|
606
|
Tue Jul 8 11:46:55 2025 |
Maple Matzner | Update | TCS | Update on SURF progress for Jul 8 |
|
| Attachment 1: Maple_TCS_update_jul_8.pdf
|

|
|
607
|
Tue Jul 8 12:15:04 2025 |
Tyler | Update | TCS | CyMAC ADC Noise Update |
| [Tyler, Christina, Ma, Mary]
Below is attached the ADC noise floor of two CyMAC channels vs the Red Pitaya.
The frequency resolution of these RIN spectra are 16 Hz, with N_meas = 19,308,426 for the CyMAC, and N_meas = 263,024. |
| Attachment 1: ADC_comps.pdf
|

|
|
608
|
Thu Jul 10 16:41:18 2025 |
Christina | Update | TCS | |
[Christina, Ma, Tyler]
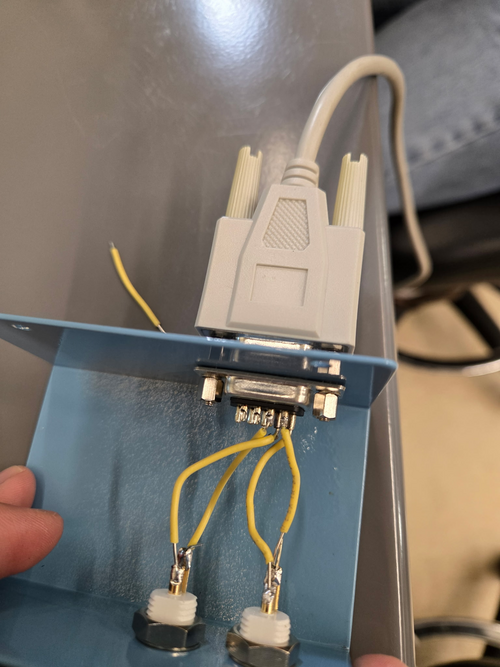
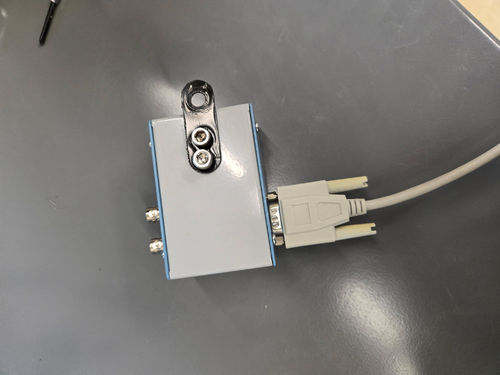
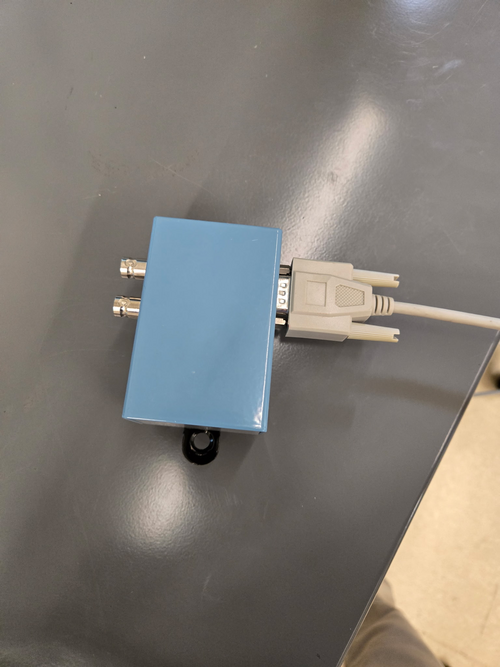
Pomona Box completed and is now on the server rack in 1119. Additionally, the photodetectors were connected to the box and set up in front of the heater elements. |
| Attachment 1: 2994921113032912040.JPG
|
|
| Attachment 2: 4717009101108174053.JPG
|
|
| Attachment 3: 5782646701589802125.JPG
|
|
|
611
|
Tue Jul 15 10:40:23 2025 |
Christina | Update | TCS | |
[Christina, Ma, Tyler]
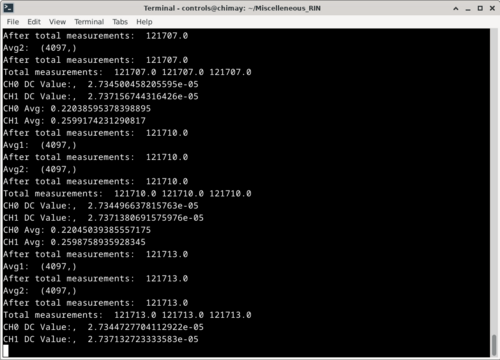
Yesterday, Ma and I started taking data for the PSD/CSD measurements while the photodetectors and one of the heater elements are on (8) and are using the Red Pitaya to compare it to the data we took for the same measurements on the CyMAC. It will be finished Wednesday morning, and then we plan on starting to take additional recordings in order to conduct the same type of comparison for the dark noise measurements. |
| Attachment 1: rpon.png
|
|
|
614
|
Tue Jul 15 13:13:48 2025 |
Christina | Update | TCS | Photodetector optical post assembly |
|
| Attachment 1: pdreassembly.png
|
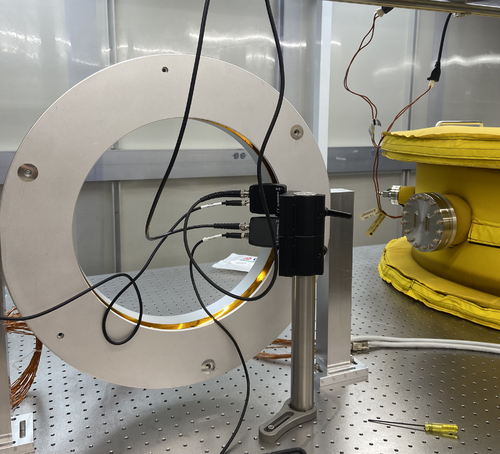
|
|
615
|
Tue Jul 22 12:20:29 2025 |
Christina | Update | TCS | |
[Ma, Christina, Tyler]
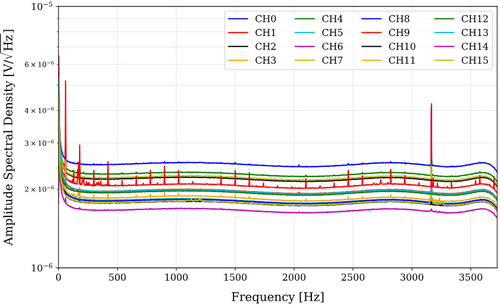
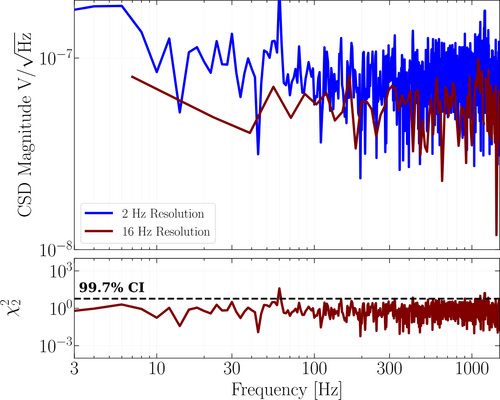
Figure 1 shows the following PSDs for channels 0-15 from the 14 hour test. Figure 2 shows the reduced chi squared and CSD plots for both the 2 Hz and 16 Hz resolutions.
|
| Attachment 1: PSDch0-15.png
|
|
| Attachment 2: CSD2hz_16hz.png
|
|
|
617
|
Tue Jul 29 11:45:19 2025 |
Maple | Update | TCS | Meeting update |
|
| Attachment 1: Maple_TCS_update_jul_29.pdf
|

|
|
619
|
Tue Jul 29 12:30:00 2025 |
Christina | Update | TCS | 260 hour ADC update |
[Ma, Christina, Tyler]
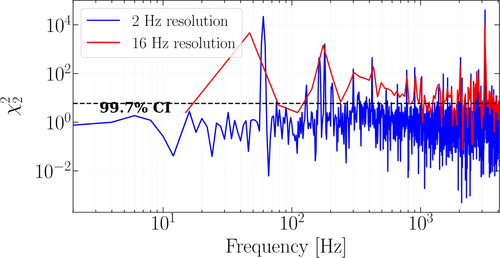
ADC CyMAC 260 hr, 8192Hz sampling rate channels V3 and Vref6 |
| Attachment 1: CSD_06_28_25_270hr.png
|
|
|
624
|
Mon Aug 11 22:19:50 2025 |
Christina | Update | TCS | Red Pitaya Data Streaming |
[Ma, Tyler, Christina]
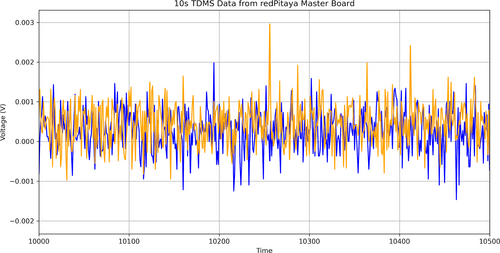
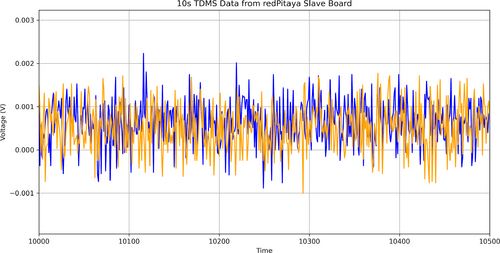
This past week, we were able to set up the data streaming for continuous acquisition to the PCs, and can conduct the initial tests now. We were able to do this by:
- Installing the correct OS ecosystems to each Red Pitaya
- Installing the terminal streaming client
- Debugging formatting and file saving issues by saving the data in a TDMS file on the host PC.
We have started streaming the ADC data on Monday from both boards for 2 days, which are currently in the clean room. Below are the ADC tests we performed before starting the 2-day run. (Time in ms) |
| Attachment 1: 3.png
|
|
| Attachment 2: 3-1.png
|
|
|
627
|
Tue Aug 12 13:28:00 2025 |
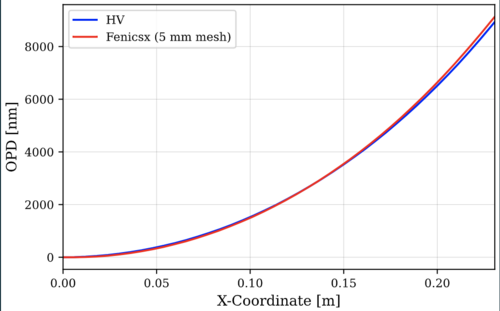
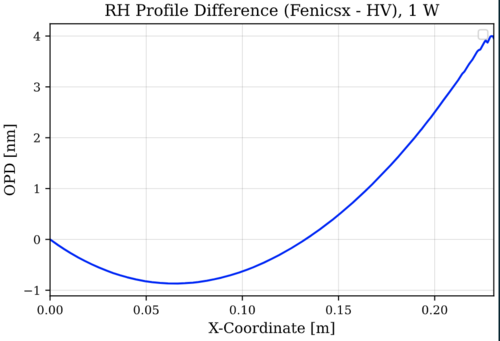
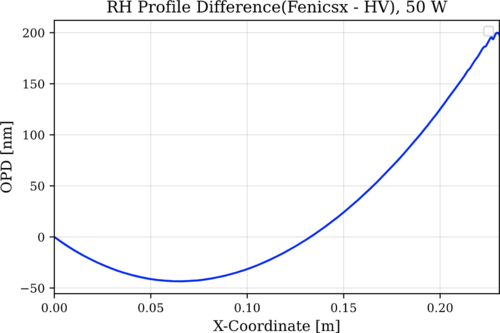
Tyler | Update | TCS | RH Fenicsx v. HV |
|
| Attachment 1: Profile_comparison.png
|
|
| Attachment 2: 1W_diff.png
|
|
| Attachment 3: 50W_diff.png
|
|
|
631
|
Tue Aug 19 12:08:40 2025 |
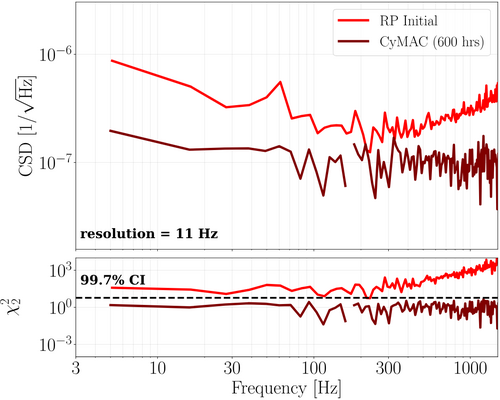
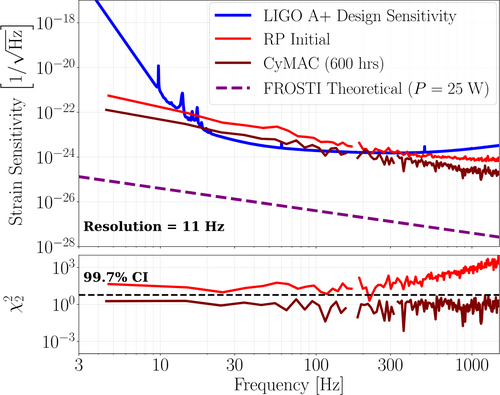
Christina | Update | TCS | RP Initial vs CyMAC Plot Comparisons |
| [Tyler, Ma, Christina]
These are the frequency averaged and veto binned plots for the initial Red Pitaya and CyMAC systems. |
| Attachment 1: 11hzCSD.png
|
|
| Attachment 2: 11hzstrain.png
|
|
|
632
|
Tue Aug 19 12:33:59 2025 |
Pooyan | Update | TCS | A# BS Update |
|
| Attachment 1: A#_beamsplitter_thermal_lensing.pdf
|

|
|
636
|
Tue Aug 26 13:09:03 2025 |
Tyler | Update | TCS | O6 RH Update |
| [Tyler]
Below are slides giving an update on RH O6 design progress.
Slides |
|
637
|
Tue Sep 2 11:53:34 2025 |
Tyler | Update | TCS | RIN Infrastructure Update (09/02/2025) |
| [Ma, Tyler]
Below are slides discussing RIN infrastructural updates related to the CyMAC.
Slides
|
|
642
|
Tue Sep 9 12:06:38 2025 |
Tyler | Update | TCS | RH O6 Update |
| Slides |
|
648
|
Tue Sep 23 13:10:07 2025 |
Tyler | Update | TCS | RH O6 Update 09/23/25 |
| Slides |
|
650
|
Tue Sep 30 12:51:23 2025 |
Tyler | Update | TCS | O6 RH Update 09/30/2025 |
| Slides |
|
664
|
Thu Nov 20 13:54:34 2025 |
Tyler | Update | TCS | FROSTI A# Optimization and Mesh Convergence Analysis |
| Attached below are slides discussing FROSTI A# Irradiance optimization and mesh convergence analysis for penetration depth. |
| Attachment 1: Updates_11_19_2025-3.pdf
|

|
|
665
|
Thu Dec 4 12:10:19 2025 |
Tyler | Update | TCS | FROSTI A# Profiles and Element Width Optimization |
| Slides |
|
666
|
Thu Dec 18 12:51:13 2025 |
Tyler | Update | TCS | FROSTI A# Profiles Update |
| Slides |
|
667
|
Thu Jan 8 12:51:03 2026 |
Tyler | Update | TCS | FROSTI A# Update 01/08/2026 |
| Slides |
|
668
|
Thu Jan 15 12:52:58 2026 |
Tyler | Update | TCS | A# FROSTI Profiles 01/15/26 |
| Slides |
|
669
|
Thu Jan 15 13:52:55 2026 |
Xuesi Ma | Update | TCS | FROSTI A# Reflector Update |
| Slides |
|
673
|
Thu Jan 22 14:06:00 2026 |
Xuesi Ma | Update | TCS | FROSTI A# Reflector Update |
| Slides |
|
674
|
Wed Jan 28 11:29:30 2026 |
Tyler | Update | TCS | A# FROSTI Profiles 01/15/26 |
A# Profile optimization update for 01/28/2026 group meeting.
Slides |
|
678
|
Thu Feb 5 13:12:28 2026 |
Tyler | Update | TCS | A# FROSTI Profiles 01/15/26 |
Slides updating progress on FROSTI A# irradiance profiles and reflector design. Edge roll-off is now included for thermoelastic deformation corrections.
| Quote: |
A# Profile optimization update for 01/28/2026 group meeting.
Slides |
|
|
687
|
Thu Feb 19 12:59:47 2026 |
Tyler | Update | TCS | A# FROSTI Profiles 01/15/26 |
Slides covering a new approach to optimizing for A# FROSTI profiles. In particular, we start looking at just optimal RH correction. Once this profile is determined, we then minimize the residual further with FROSTI profiles.
| Quote: |
Slides updating progress on FROSTI A# irradiance profiles and reflector design. Edge roll-off is now included for thermoelastic deformation corrections.
| Quote: |
A# Profile optimization update for 01/28/2026 group meeting.
Slides |
|
|
|
690
|
Thu Mar 5 13:01:14 2026 |
Tyler | Update | TCS | A# FROSTI Profiles Optimization |
Slides discussing updates on FROSTI A# profile optimizations. In particular, a new RMS function is defined which reduces inner-radii wavefront error variation to a greater degree.
| Quote: |
Slides covering a new approach to optimizing for A# FROSTI profiles. In particular, we start looking at just optimal RH correction. Once this profile is determined, we then minimize the residual further with FROSTI profiles.
| Quote: |
Slides updating progress on FROSTI A# irradiance profiles and reflector design. Edge roll-off is now included for thermoelastic deformation corrections.
| Quote: |
A# Profile optimization update for 01/28/2026 group meeting.
Slides |
|
|
|
|
694
|
Wed Apr 1 15:02:30 2026 |
Tyler | Update | TCS | A# FROSTI Profiles Optimization 04/02/2026 |
Slides discussing SURF, OPD, and SURF+OPD optimizations for idealized FROSTI A# profiles.
| Quote: |
Slides discussing updates on FROSTI A# profile optimizations. In particular, a new RMS function is defined which reduces inner-radii wavefront error variation to a greater degree.
| Quote: |
Slides covering a new approach to optimizing for A# FROSTI profiles. In particular, we start looking at just optimal RH correction. Once this profile is determined, we then minimize the residual further with FROSTI profiles.
| Quote: |
Slides updating progress on FROSTI A# irradiance profiles and reflector design. Edge roll-off is now included for thermoelastic deformation corrections.
| Quote: |
A# Profile optimization update for 01/28/2026 group meeting.
Slides |
|
|
|
|
|
696
|
Thu Apr 9 12:40:24 2026 |
Xuesi Ma | Update | TCS | A# Ring Heater Design |
Slides discussing for A# Ring Heater design.
|
|
699
|
Thu Apr 16 13:14:42 2026 |
Tyler | Update | TCS | A# FROSTI Profiles Optimization 04/02/2026 |
Slides discussing including overlapped irradiance profiles at the center of an A# ITM.
| Quote: |
Slides discussing SURF, OPD, and SURF+OPD optimizations for idealized FROSTI A# profiles.
| Quote: |
Slides discussing updates on FROSTI A# profile optimizations. In particular, a new RMS function is defined which reduces inner-radii wavefront error variation to a greater degree.
| Quote: |
Slides covering a new approach to optimizing for A# FROSTI profiles. In particular, we start looking at just optimal RH correction. Once this profile is determined, we then minimize the residual further with FROSTI profiles.
| Quote: |
Slides updating progress on FROSTI A# irradiance profiles and reflector design. Edge roll-off is now included for thermoelastic deformation corrections.
| Quote: |
A# Profile optimization update for 01/28/2026 group meeting.
Slides |
|
|
|
|
|
|
709
|
Tue May 5 12:58:53 2026 |
Tyler | Update | TCS | FROSTI A# Profiles 05/07/2026 Group Meeting |
| Slides detailing the incorporation of minimizing curvature overlap between FROSTI and ring heater actuation profiles. |
|
720
|
Thu Jun 25 11:42:29 2026 |
Mary | Update | TCS | Beam position optimization algorithm |
|
Weight Calibration: this study looks at how the thermal-compensation system should be tuned as the laser beam moves off-center on a detector mirror, with a fixed point-absorber defect in place. The optimizer that sets the actuator powers tries to flatten the wavefront, and it balances two kinds of distortion( i.e. surface distortion against substrate optical-path distortion) by a ratio that had been fixed at 20:1, but that value was only validated for a centered beam. So here I sweeps this ratio across beam positions from 0–5 cm along +x, with and without the absorber, re-optimizing the actuator powers at each position and judging each choice by the resulting power recycling gain from the fully locked interferometer.
Slides |
|
748
|
Tue Sep 1 11:50:44 2026 |
Ruaraidh Dumbreck | Update | TCS | COMSOL modeling for the ring heater |
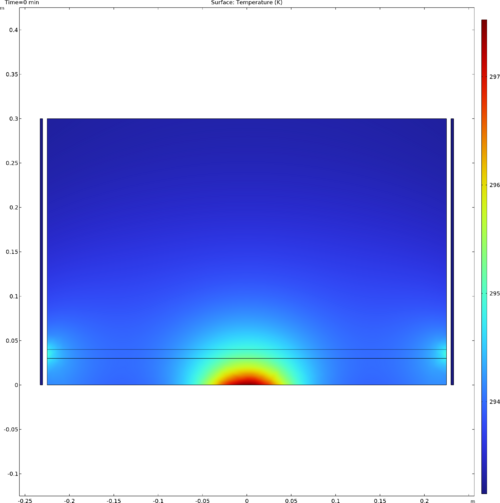
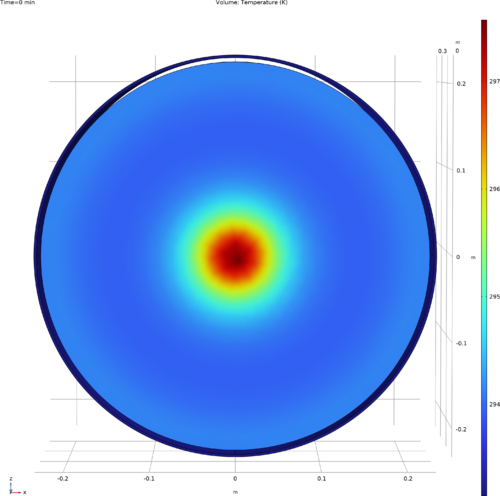
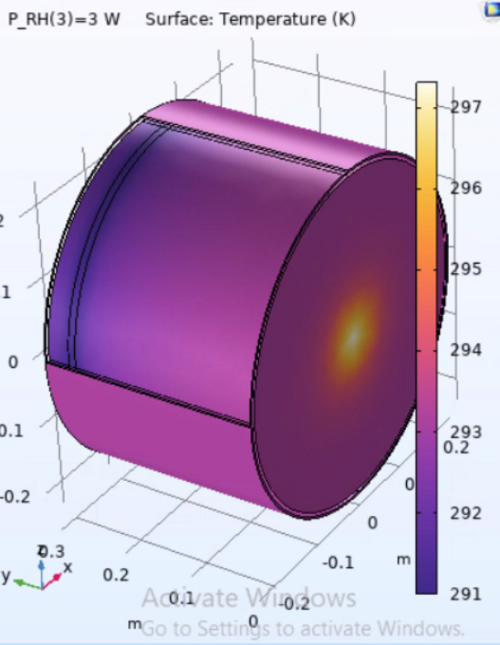
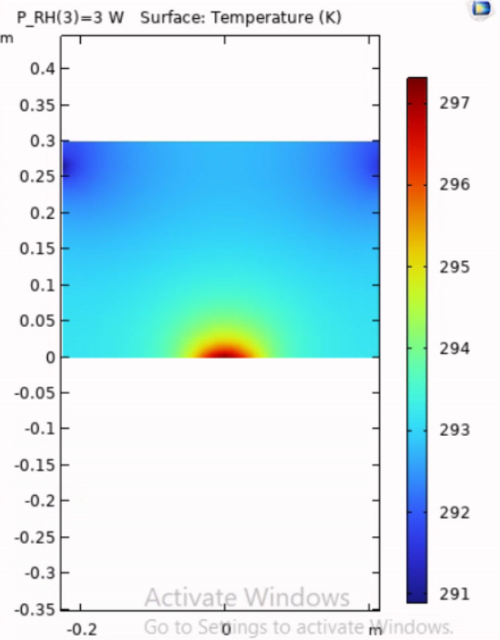
| I’ve set up the base COMSOL model for Cosmic Explorer ITM optics (450 mm diameter × 300 mm thickness). I implemented the absorbed heat power in the Heat Transfer module—using 1 W of self-heating and an exaggerated 150 W ring heater power to make the initial thermal gradients easily visible.
Next, I need to couple the Solid Mechanics physics to compute front-surface thermal expansion, then run a parametric sweep on the ring heater power to find the value that minimizes total thermal distortion." |
| Attachment 1: WithRH2D.png
|
|
| Attachment 2: WithRH3D.png
|
|
|
749
|
Thu Sep 3 10:14:21 2026 |
Ruaraidh Dumbreck | Update | TCS | COMSOL modeling for the ring heater + Shield |
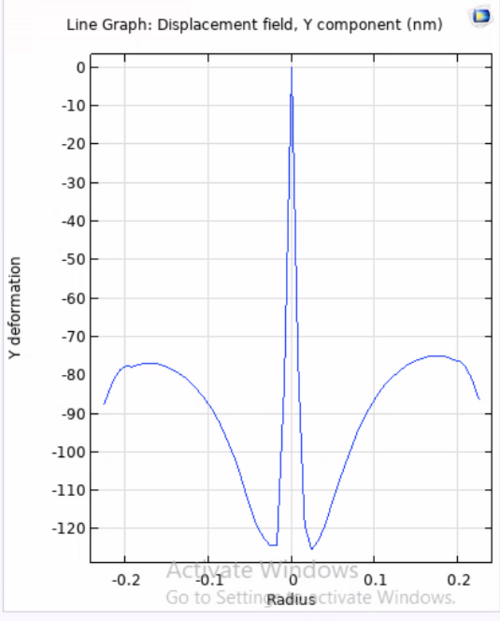
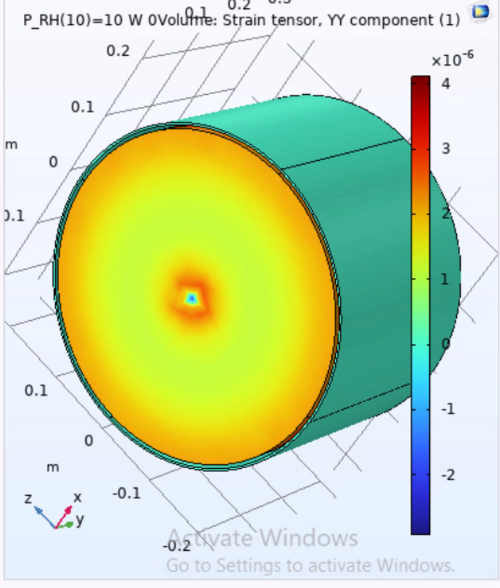
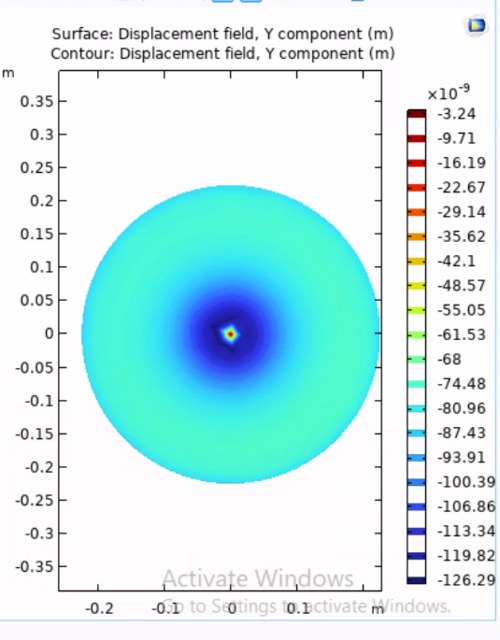
| I had a bit of trouble with the deformation model for the simulation but ive fixed it now, although some of the scales are still in meters. I have seperated the thermal calculation and the thermoelastic deformation into 2 seperate studys. I can parameter sweep the first study but i am currently having issues with the 2nd study that i am trying to troubleshoot.
I have also set im an expression calculator to measure the change in deformation in "v" (the displacement component in the y axis) through the expression "= ABS(vmax)-ABS(vmin)" and im trying to get comsol to return the value of the ring heater power at which this is minimised. Then after this i want to conduct another parameter sweep of ring heater seperation from the barrel and repeat the same previous sweeps so i can try and produce a graph of optimal ring heater power against distance of the shield from the ITM.
im unsure if my method of using the minimum total deformation in v is accurate to finding the ring heater power needed to compensate for the self heating, which is currently set to 1W |
| Attachment 1: 1d.png
|
|
| Attachment 2: 3d.png
|
|
| Attachment 3: 2d.png
|
|
|
750
|
Thu Sep 10 10:45:52 2026 |
Ruaraidh Dumbreck | Update | TCS | COMSOL modeling for the ring heater |
| Since last week, I have put the ring heater on the correct side of the optic and found that the thermal modelling is being limited by the solid mechanics of the optic, particularily the fixed point on the AR face of the optic. I have been looking into different methods of modelling but not found a solution as of yet. The silver lining is that i have managed to tie the displacement to the parameter sweep. i have also started reading and learning Braket notation again ahead of the next step for a true parameter sweep. I will try and see if i can send the file to the COMSOL engineers aswell. I have not yet checked if the displacements are accurate given the powers im simulating, so it is by no means a final result. |
| Attachment 1: plot_3.png
|
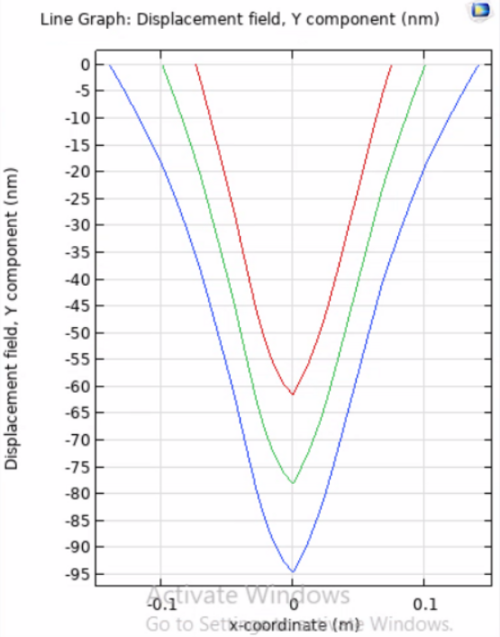
|
| Attachment 2: plot_2.png
|
|
| Attachment 3: plot_1.png
|
|
|
752
|
Thu Sep 17 11:52:48 2026 |
Ruaraidh Dumbreck | Update | TCS | COMSOL modeling for the ring heater preliminary run |
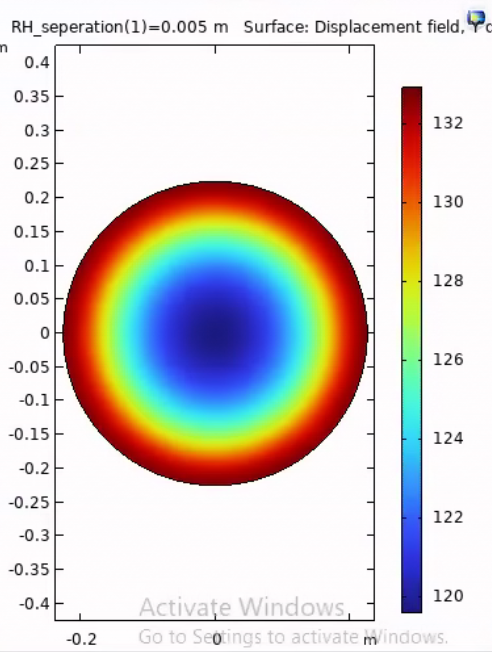
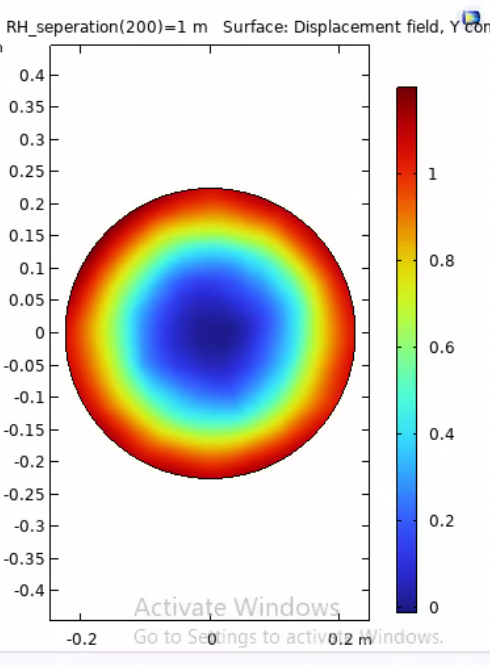
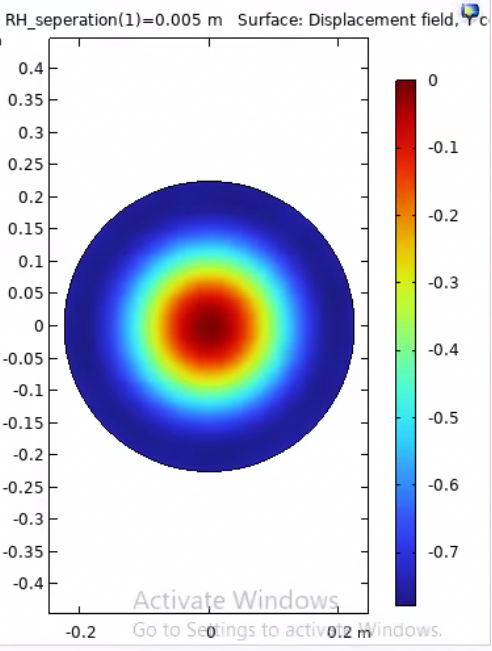
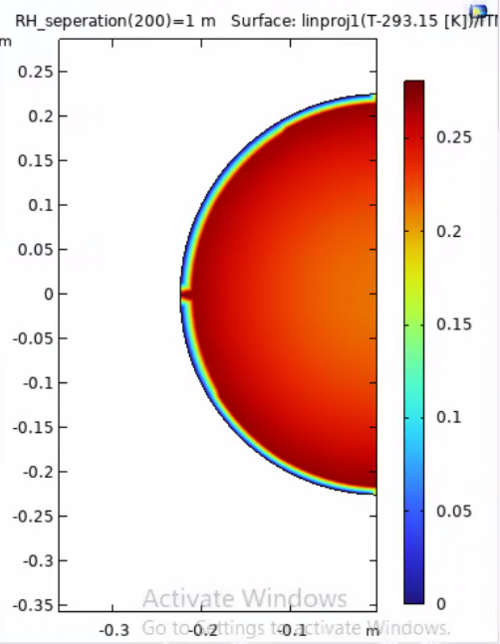
| This week i have fixed the study to model deformation and thermal expansion in 1 study and corrected some errors in the system.
I have seperated the study into 2 simulations. 1 modelling the heat flux of the ring heater, for 1W deposited power, only and another modelling the heat flux of the self induced heating, also 1W deposited power.
since the ring heater heat is deposited closer to the AR face, i made the fixed constraint for this model the middle of the HR face. and since the self heating is primarily operating on the HR face, i made the fixed constraint for this model the middle of the AR face.
I then ran a parameter sweep of the shield seperation from the ITM between 5mm and 1m.
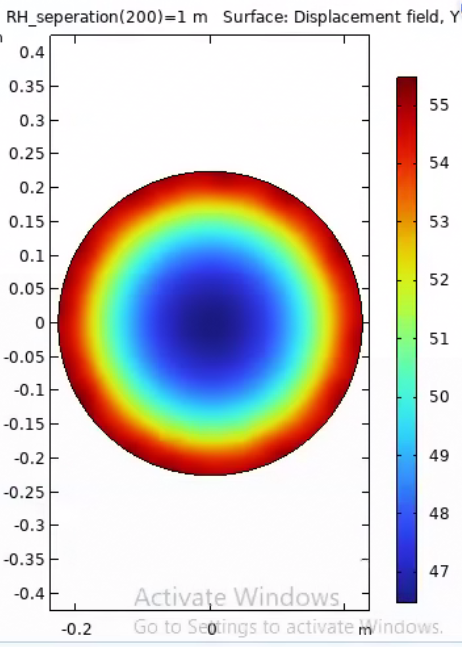
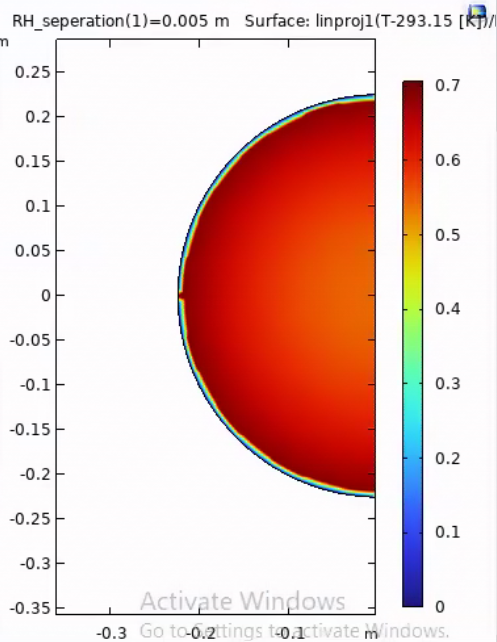
attached are the plots for the HR and AR surface deformation at the 2 extremes for the ring heater heating maps (note, i made an error on the the self heating plots where i didnt move the fixed constraint and only vaired the seperation by 0.1m. I will re run the simulation with these corrections).
i beleive the models of the displacementr in the y axis look as we would expect, however the 2D heat map may have some mechanical/boundary constraints that need double checked. |
| Attachment 1: AR_surface_deformation_1m.png
|
|
| Attachment 2: AR_surface_deformation_5mm.png
|
|
| Attachment 3: HR_surface_deformation_1m.png
|
|
| Attachment 4: HR_surface_deformation_5mm.png
|
|
| Attachment 5: heat_map_1m.png
|
|
| Attachment 6: heat_map_5mm.png
|
|
|
753
|
Thu Sep 24 14:00:51 2026 |
Ruaraidh Dumbreck | Update | TCS | debugging and troubleshooting |
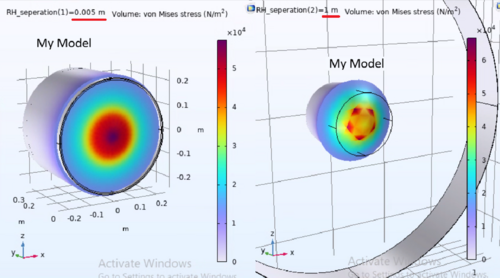
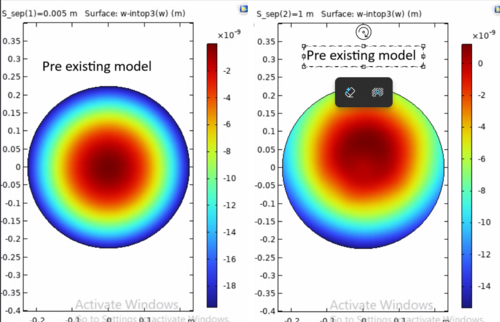
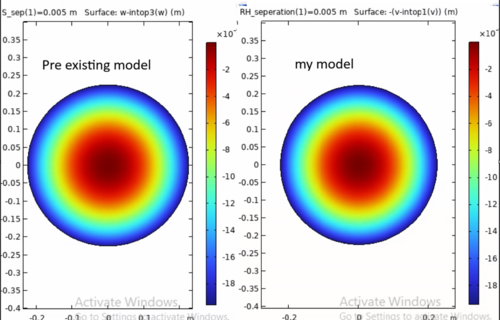
| I am in the process of comparing my model to the pre existing model used for current ligo parameters. the aim is to have 2 studies, 1 where i change the parameters of the existing model to that of A#, remove the CP and add a shield. Another to change my model to the parameter and geometry of the existing ALIGO model (without a CP) and see if our deformation plots produce the same results.
I am having some troubleshooting issues with both models as there appears to be some kind of asymmetric heating happening for the self induced heating. as well as this, i discovered that my model stress doesnt make sense (the optic has more stress the further away the shield is.
the only positive report i have to show currently is that the AR values for the self induced heating with the shield at its closest point are the same. i will cpntinue to debug these issues. |
| Attachment 1: Screenshot_2026-09-24_134753.png
|
|
| Attachment 2: Screenshot_2026-09-24_135028.png
|
|
| Attachment 3: Screenshot_2026-09-24_135315.png
|
|
|
754
|
Thu Oct 1 13:04:03 2026 |
Ruaraidh Dumbreck | Update | TCS | COMSOL Shield modeling (My model scaled to PRL model parmeters) |
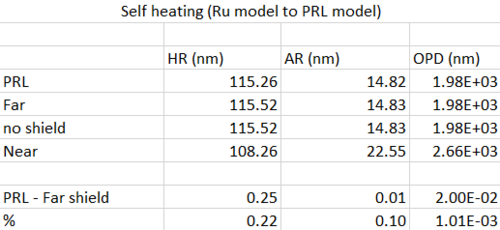
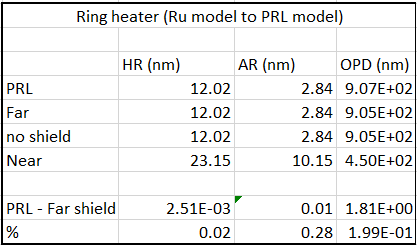
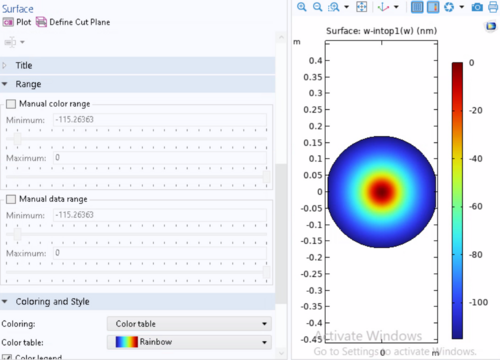
| so i have managed to produce good results for my model. I have managed to produce results that agree withing ~0.2%. The metric im using to compare the 2 models is the results sub plot node->data range. This data range shows the maximum+ minimum values for the data being plotted (example attached). in the case of these graphs one of either the maxima or minima are 0 (depending on orientation of the geometry). I have managed to acheive very close values for HR+AR deformation as well as OPD. These values were calculated using the same method and expression as the PRL model. While im happy i have acheived these results, I am unsure how i have changed the model to acheive this. I updated an older version of the model and this one works very well. so i am currently diagnosing the difference between the working model and the model i was working on for days so identify what happened.
i have not yet managed to confirm the models match when I scale them both up to A+ parameters as of yet, I beleive the reasoning lies in the result of the above diagnosis. |
| Attachment 1: self.png
|
|
| Attachment 2: RH.png
|
|
| Attachment 3: PRL_self_HR.png
|
|
|
162
|
Tue Jul 18 14:13:46 2023 |
Sophia | Update | Scripts/Programs | Update on Laser Noise Data Collection and Analysis |
| We [Sophia and Tyler] have found a code which will partition our data and generate PSD's and CSD's automatically. We are now in the stage of writing this into a dynamic code, which so far has been fast-paced because of the framework we have built for it over the past few weeks.
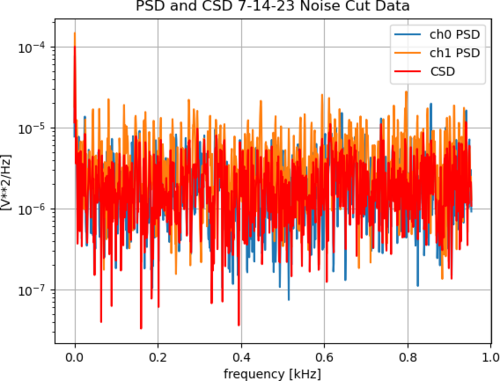
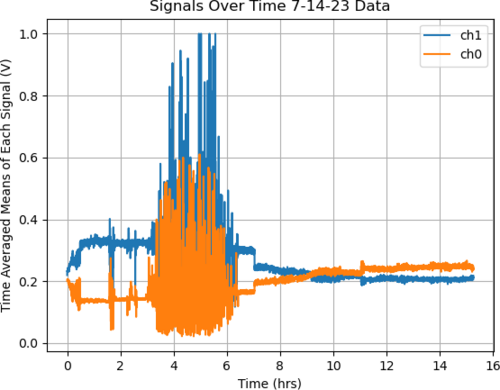
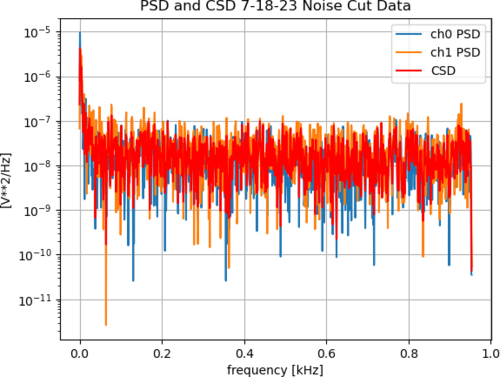
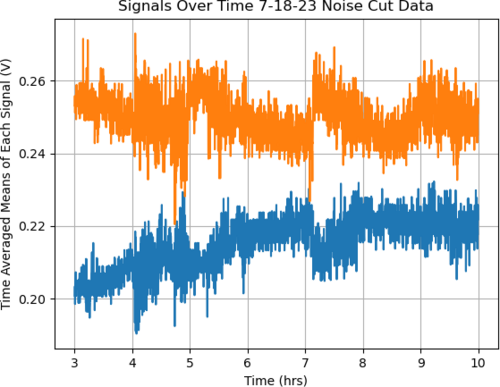
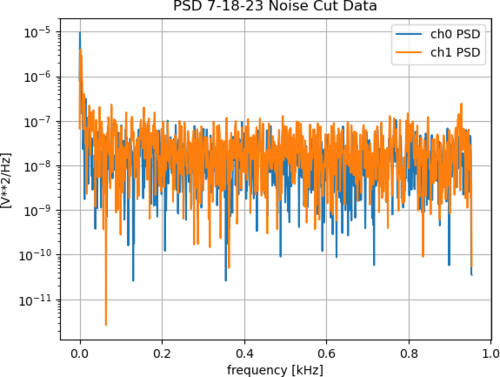
Something to note is that we have found, especially over long periods of time, the laser goes through periods of extreme noise and the signals often cross from where we set them at some point throughout our data collection. We have made the assumption that this is something to do with the laser itself, and not our setup or surrounding space because of both the times that these noise/intensity spikes took place and the duration of the spikes (1.5-2.5 hours). To try and correct for this, we have been "cutting" the noise, and just looking at sections which don't include these big fluctuations. An example of the "noise cut data" is shown in the graph titled "Signals Over Time 7-18-23 Noise Cut Data" and all of the PSD/CSD graphs have been made using only these "noise cut" regions. |
| Attachment 1: 7_14_23_cut_analyzed_graph.png
|
|
| Attachment 2: 7_14_23_raw_graph.png
|
|
| Attachment 3: 7_18_23_cut_analyzed_graph.png
|
|
| Attachment 4: 7_18_23_raw_graph_(1).png
|
.png.png "7_18_23_raw_graph_(1).png")
|
| Attachment 5: 7_18_23_cut_raw_graph.png
|
|
| Attachment 6: 7_18_23_cut_just_PSD_analyzed_graph.png
|
|
|
174
|
Thu Jul 27 11:28:36 2023 |
Sophia | Update | Scripts/Programs | Update on Laser Noise Data Collection and Analysis: Dynamic CSD and PSD Plots |
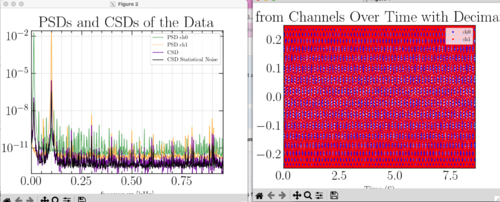
| This week I have successfully been able to implement our dynamic CSD and PSD plotting code, but along the way I encountered a few challenges which I will outline in this elog post.
Challenges:
1. Once I was able to plot the data through time, I produced a graph of the raw data (shown below in the top to images) which showed pulsed data instead of a continuous stream. On Tuesday (26th of July) Tyler and I fixed this issue, realizing that calling the starting the trigger in the red pitaya was the issue. When I commented that line of code out, it immediately started plotting continuously.
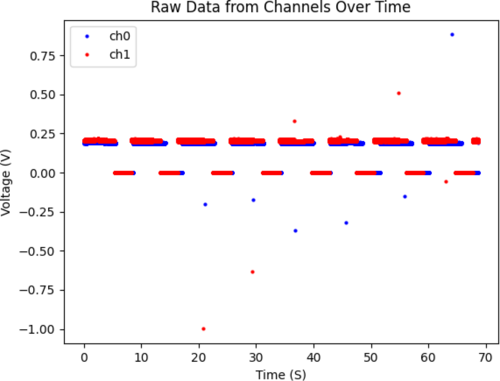
2. When that issue was solved, We then started having problems with the automatically generated lines in the python program which would double back on each new iteration. I am still dealing with this issue, because the line likes to follow the progression of the data intake instead of through the plot. Currently, I am trying to plot the data as a scatter plot and then add the line as this might make it care only about the data's distribution instead of the order of the points in the list, but I am still unsure. I might try out np.sort (or some equivalent to sort the entire data set before plotting) as well. |
| Attachment 1: Screenshot_2023-07-26_at_3.02.05_PM.png
|
|
| Attachment 2: Screenshot_2023-07-26_at_1.38.47_PM.png
|
|
| Attachment 3: Screenshot_2023-07-27_at_1.36.24_PM.png
|
|
| Attachment 4: Screenshot_2023-07-27_at_1.33.01_PM.png
|
|
|
175
|
Thu Jul 27 14:11:42 2023 |
Sophia | Update | Scripts/Programs | Update on Laser Noise Data Collection and Analysis: Dynamic CSD and PSD Plots |
| Here's a screen recording of the dynamic raw data and PSD/CSD plots as they are now. Will begin working on implementing a code to generate the statistical estimator for the CSD uncertainty now. (Will talk to Tyler more about whether I can get the lines to happen or not) |
| Attachment 1: Screen_Recording_2023-07-27_at_5.08.25_PM.mov
|
|
183
|
Mon Jul 31 19:27:30 2023 |
Sophia | Update | Scripts/Programs | Update on Laser Noise Data Collection and Analysis: Dynamic CSD and PSD Plots |
| An update on the CSD/PSD code:
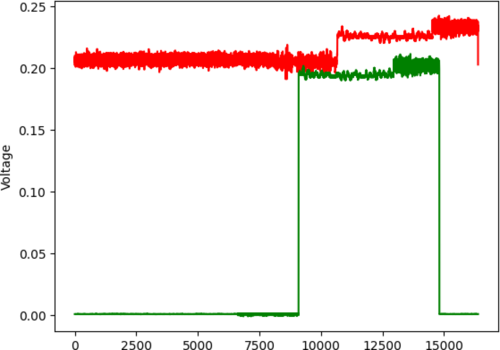
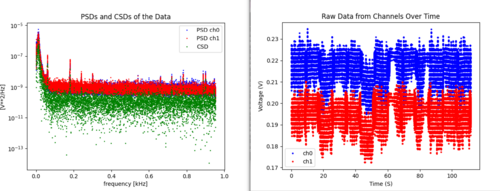
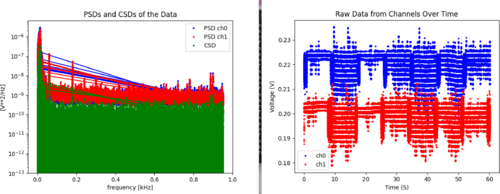
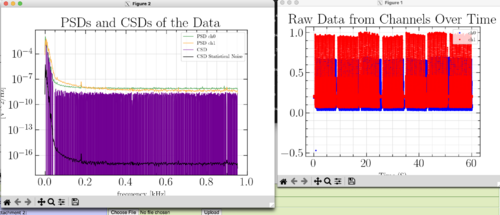
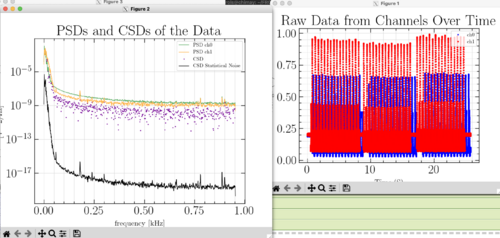
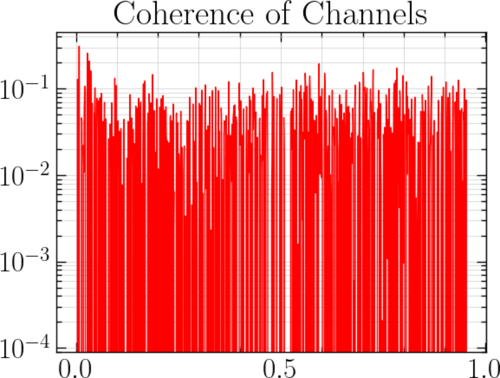
The code is now taking a dynamic average of the points, and that has significantly reduced the noise that we were reading and the issues I was having with the lines in the plots. The graph for the CSD is still putting up a fight though, and amassing many lines that do not appear when just scatter plotted. I plan to fix that tomorrow, alongside inserting my own generated signal into the data. I have plotted the coherence alongside these graphs (as shown in the first screen recording and in one of the images), and it is significantly less than 1-- starting at or below 10^(-1).
As a note, I am unsure of why the raw data looks like this-- the laser goes through periods of extreme noise and I think this data was taken during one of them. |
| Attachment 1: Screenshot_2023-07-31_at_10.18.44_PM.png
|
|
| Attachment 2: Screen_Recording_2023-07-31_at_10.16.31_PM.mov
|
| Attachment 3: Screen_Recording_2023-07-31_at_10.19.55_PM.mov
|
| Attachment 4: Screenshot_2023-07-31_at_10.21.44_PM.png
|
|
| Attachment 5: Screenshot_2023-07-31_at_10.26.34_PM.png
|
|
|
186
|
Tue Aug 1 15:44:31 2023 |
Sophia | Update | Scripts/Programs | Update on Laser Noise Data Collection and Analysis: Dynamic CSD and PSD Plots |
| We have identified two problems facing the intensity noise calculations, which we are working to solve.
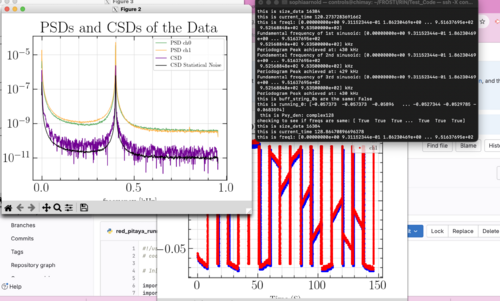
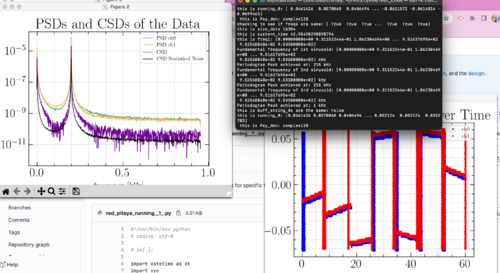
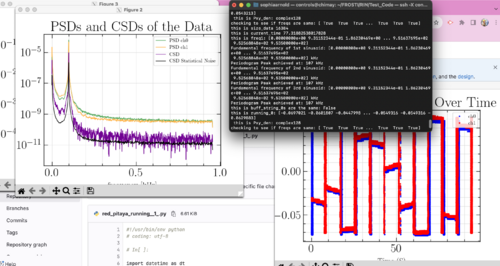
The first of these problems, is that the red pitaya appears to be taking data approximately 4 times faster than we would expect from the decimation rate based on how quickly it runs. To see if this was affecting our data, we plugged the red pitaya into a function generator. We found that my code is able to identify the driving frequency, but consistently gives predictions that are roughly 7% greater than we expect. When we drive at 100 Hz, the plot says the peak is at 107 Hz, when driven at 400 Hz, we see between 422-427 Hz, etc. While this implies that the red pitaya is not taking data at a faster rate than we would expect (if it did we would anticipate a lower than expected frequency, by a factor of roughly 4), it does imply some intrinsic issue with either the red pitaya or with the code. To fix this, I am going to use my code on artificially generated signals and see if we still observe these issues. |
| Attachment 1: Screen_Recording_2023-08-01_at_5.28.39_PM.mov
|
| Attachment 2: Screen_Recording_2023-08-01_at_5.29.46_PM.mov
|
| Attachment 3: Screen_Recording_2023-08-01_at_5.31.00_PM.mov
|
| Attachment 4: Screenshot_2023-08-01_at_5.42.53_PM.png
|
|
| Attachment 5: Screenshot_2023-08-01_at_5.44.34_PM.png
|
|
| Attachment 6: Screenshot_2023-08-01_at_5.45.35_PM.png
|
|
|
194
|
Mon Aug 7 15:36:18 2023 |
Sophia | Update | Scripts/Programs | Update on Laser Noise Data Collection and Analysis: Dynamic CSD and PSD Plots |
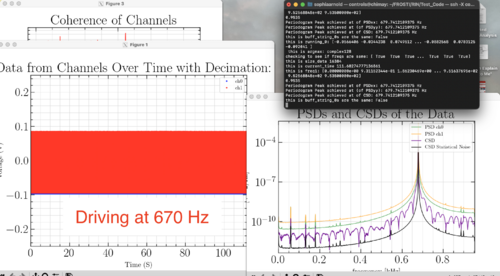
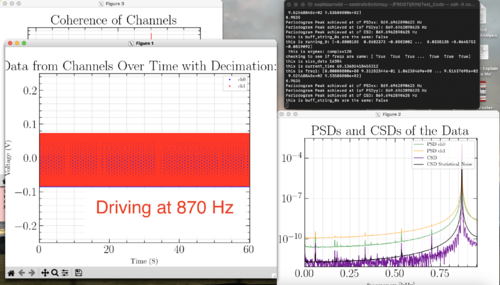
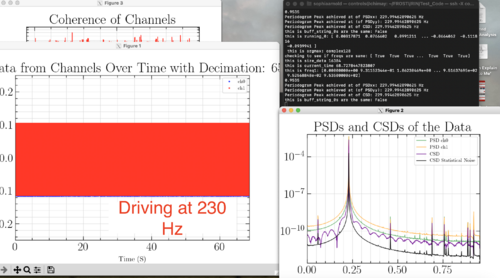
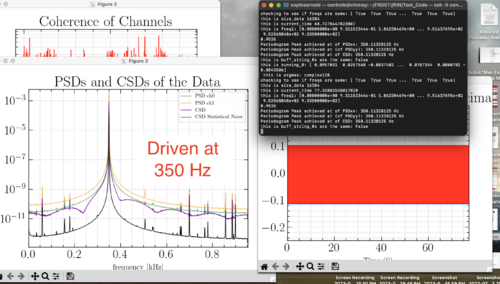
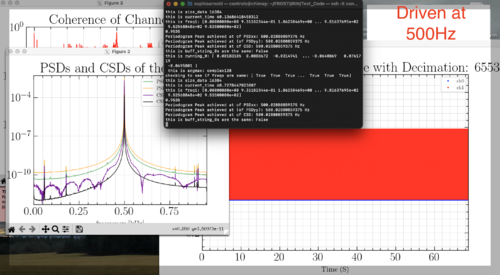
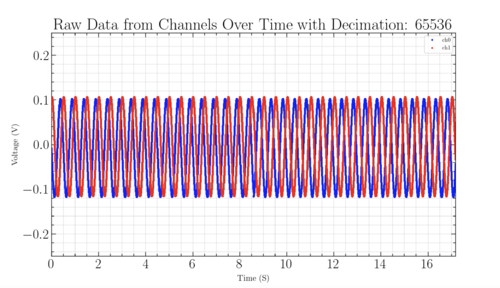
| Today I was able to fix the red pitaya's plotting problem, and get my code to recognize driving frequencies from the function generator to within a 0.5 Hz estimation. The sinusoidal plots I have included are from sending a 1 Hz signal into the red pitaya to see the signal in real time. This allowed me to see exactly where the system was messing up, and fix from the ground up. Once I had that working, I began to test sending in frequencies in the range that my PSD/CSD code could observe and I was able to identify each driving frequency within 0.5 Hz. My code was able to correctly identify a 500 Hz signal, while other analyzed frequencies in the observable range have fallen lower than the sent in frequency by a less than 0.5 Hz. I believe this issue comes from the strange speed that the red pitaya is still acquiring data, even with my fixing it to now observe a continuous signal. |
| Attachment 1: Screenshot_2023-08-07_at_6.19.44_PM.png
|
|
| Attachment 2: Screenshot_2023-08-07_at_6.16.40_PM.png
|
|
| Attachment 3: Screenshot_2023-08-07_at_6.13.47_PM.png
|
|
| Attachment 4: Screenshot_2023-08-07_at_6.06.22_PM.png
|
|
| Attachment 5: Screenshot_2023-08-07_at_6.04.28_PM.png
|
|
| Attachment 6: Screen_Recording_2023-08-07_at_5.01.54_PM.mov
|
| Attachment 7: Screenshot_2023-08-07_at_6.26.09_PM.png
|
|
|
196
|
Tue Aug 8 16:47:11 2023 |
Sophia | Update | Scripts/Programs | Update on Dynamic CSD and PSD Plots |
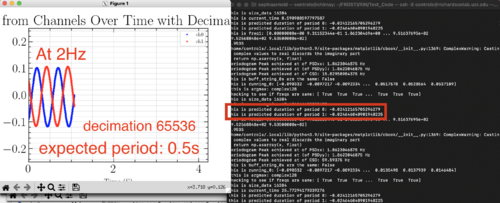
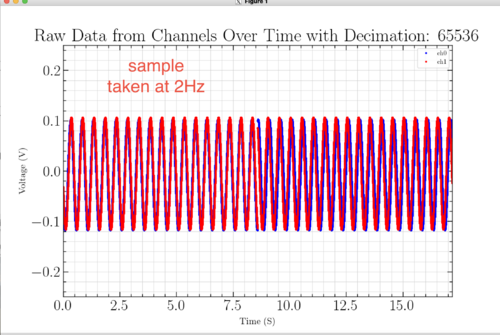
| We have fixed our rapid plotting error, and realized that this has not been affecting our data intake! Below is a video of the code progressing, alongside grabbed images of the raw data. The data is now continuous, and performs as we expect. Next, I plan to add a widget which will dynamically show the peak values instead of them just being printed in the terminal after each iteration. (Ignore the red box-- it was from me struggling with a now fixed issue). |
| Attachment 1: Screen_Recording_2023-08-08_at_7.42.30_PM.mov
|
| Attachment 2: Screenshot_2023-08-08_at_2.22.50_PM.png
|
|
| Attachment 3: Screenshot_2023-08-08_at_5.16.08_PM.png
|
|
|
206
|
Tue Aug 15 10:35:00 2023 |
Sophia | Update | Scripts/Programs | Update on Laser Noise Data Collection and Analysis: Dynamic CSD and PSD Plots |
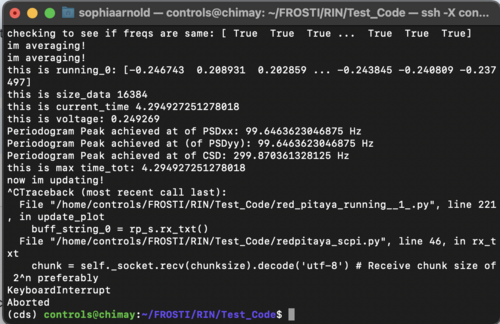
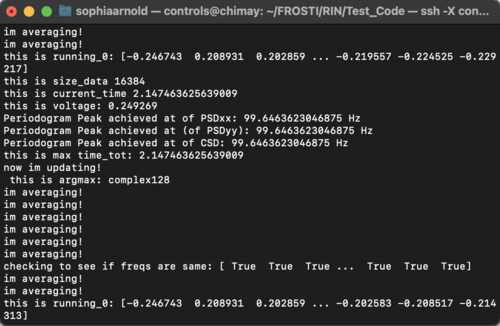
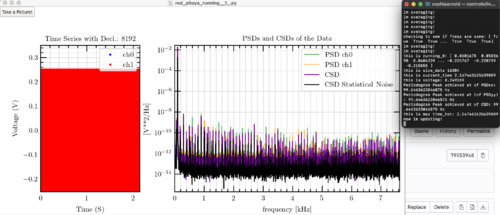
| I have successfully added a button to my graphics, but it has posed a strange issue with the CSD and PSD values. When I plot my original code, I still see the pretty peaks that I was getting originally, while my new code (as shown in the video and in the last screenshot) is giving me more of a line. In my code that gives the peak values, the CSD values also tend to fluctuate in this new code as well (shown in the first screenshot), before returning to the real value.
I think that there is a problem with the averaging and am hoping to solve this issue today with Tyler. This is good progress though! |
| Attachment 1: Screenshot_2023-08-14_at_8.18.49_PM.png
|
|
| Attachment 2: Screenshot_2023-08-14_at_8.18.43_PM.png
|
|
| Attachment 3: Screen_Recording_2023-08-14_at_8.17.50_PM.mov
|
| Attachment 4: Screenshot_2023-08-15_at_1.24.54_PM.png
|
|
| Attachment 5: Screenshot_2023-08-15_at_1.32.30_PM.png
|
|
|
207
|
Tue Aug 15 13:32:37 2023 |
Sophia | Update | Scripts/Programs | Update on Laser Noise Data Collection and Analysis: Dynamic CSD and PSD Plots |
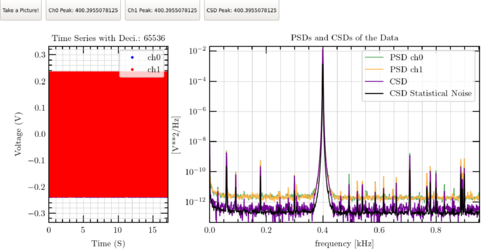
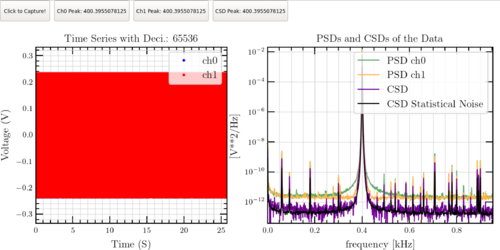
| I have now fixed all issues that I was having this morning, and have added text boxes which show the peak values of both PSD's and the CSD alongside the graphs. They also update continuously with the graph. This is shown in the top image. The laser was driven at 400Hz, and had 0.5V peak to peak voltage, both of which appear correctly in the below graphs.
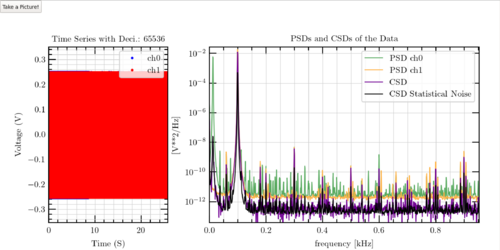
Now that the code is almost fully working (we will finish debugging the screenshot method later today), our plan tomorrow is to drive the laser and see how the code performs with it. The below graph is from us driving the function generator at 100Hz to test the range.
Update:
Bottom graph is new version of graphs with better distribution of both graphs. |
| Attachment 1: Screenshot_2023-08-15_at_4.27.58_PM.png
|
|
| Attachment 2: Screenshot_2023-08-15_at_2.21.18_PM.png
|
|
| Attachment 3: Screenshot_2023-08-15_at_5.25.05_PM.png
|
|
|
249
|
Mon Oct 30 11:03:56 2023 |
Tyler | Update | Scripts/Programs | |
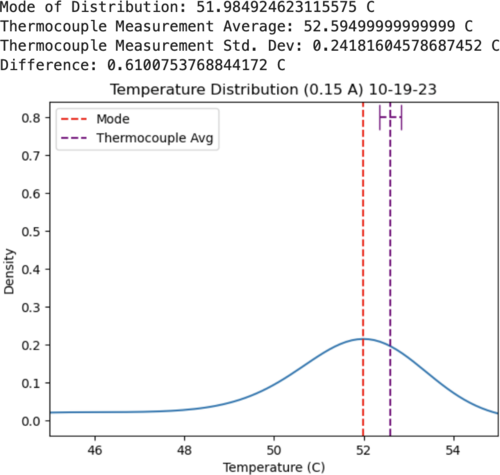
FLIR: After some adjustments, the plot generated from the FLIR measurements look much more symmetric (see attachment). There are more included grid points, which smooths out the curve as compared to last week.
Red Pitaya: It looks like a new OS update was released for the RP, which includes a new Python API (was previously only available in C). I'm going to try and update the one we have currently running in lab.
|
| Attachment 1: Screenshot_2023-10-23_at_12.39.05_PM.png
|
|
|
317
|
Tue Feb 6 22:40:25 2024 |
Michael | Update | Scripts/Programs | Long Crab 1 Design Created In Gtrace |
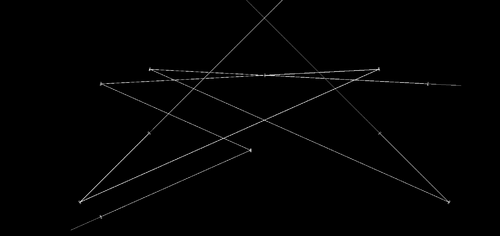
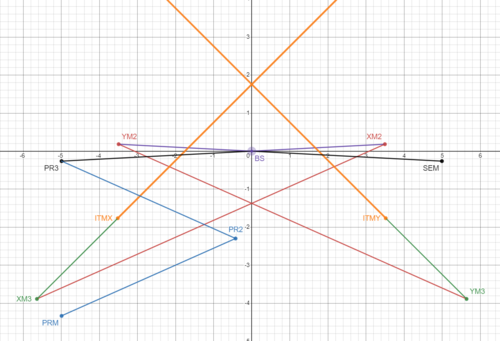
| Worked on and completed the python code for the simulation of the Long Crab 1 layout for Cosmic Explorer basing off of Pooyan's original work with the Crab 1 layout. From here I'll look into creating the shoelaces layouts. |
| Attachment 1: Long_Crab1.png
|
|
| Attachment 2: long_crab_1_desmos.PNG
|
|