| ID |
Date |
Author |
Type |
Category |
Subject |
|
328
|
Mon Feb 19 14:17:50 2024 |
Aiden | Update | VAC | Heater Element RGA Scan |
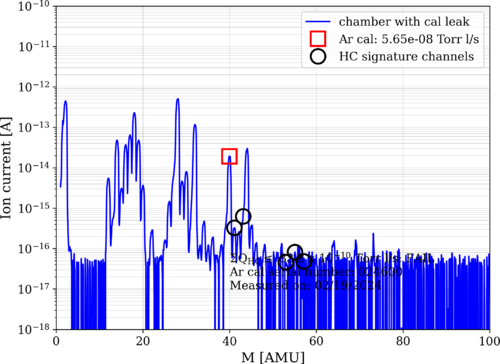
| Three days after the completion of Bake 11, the Heater elements RGA scan looks much cleaner. The HC level is back down to 33 e-10 torrl/s with the pressure at 2.13 e-8 torr. I could not take a= scan with the Argon closed as it was left open during the bake and not closed since then. |
| Attachment 1: bake11_240219_Elements_ArO.png
|
|
|
506
|
Fri Jan 31 15:03:09 2025 |
Xuesi Ma | Update | | Heater Element Circuit Check |
|
[Ma] Wed 1/29/2025
No short circuit between heater element ✓
No short circuit to ground on any pin ✓
No short circuit between connectors ✓
| Heater Number |
Power Resistor before (Ohm) |
Power Resistor now (Ohm) |
RTD Resistor before (Ohm) |
RTD Resistor now (Ohm) |
| 1 |
73.6 |
73.1 |
81.8 |
81.3 |
| 2 |
70.4 |
69.6 |
82.1 |
81.6 |
| 3 |
71 |
70.5 |
84.5 |
84 |
| 4 |
71.5 |
71 |
80 |
79.4 |
| 5 |
70.5 |
70.2 |
81.7 |
81.2 |
| 6 |
72 |
71.6 |
79.4 |
78.7 |
| 7 |
69.2 |
69 |
78.2 |
77.5 |
| 8 |
71.1 |
70.6 |
84.2 |
83.6 |
|
|
609
|
Mon Jul 14 20:45:20 2025 |
Luke | Summary | Cleanroom | HEPA filter performance metrics |
[Luke, Luis]
We’ve been looking into methods for evaluating the performance of the HEPA filters in the clean room. Measuring flow rate appears to be a promising approach, since the filter manual specifies a recommended minimum of 70 ft/min.
At the moment, we don’t have a flow rate measurement device on hand. We're currently looking into two options:
- A standard vane-style anemometer, which is more affordable but may lack sensitivity near the minimum required flow rate.
- A hot-wire anemometer, which offers better resolution and accuracy at lower speeds, though it's more expensive.
In the next few days, either Luis or I will contact Terra Universal to see if they have any measurement solutions that would integrate well with our clean room setup, or if they can recommend best practices for verifying HEPA performance. |
|
7
|
Mon Jul 11 14:29:45 2022 |
Jon | Omnistructure | General | HEPA filter installed |
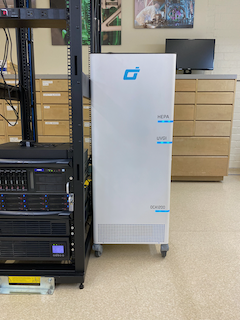
| Today I unpacked and installed the new HEPA filter for the lab. It is an Omni CleanAir OCA1210 capable of 1200 CFM. This flow rate is sufficient to turn over the air in the room once every 4 minutes, or 14 times per hour. Hopefully this will cut down on our particulate accumulation issues. |
| Attachment 1: IMG_1530.png
|
|
|
515
|
Tue Feb 18 10:02:16 2025 |
Xuesi Ma | Update | | Group Meeting Slides 2/18/2025 |
https://docs.google.com/presentation/d/1WiV2VqS0BzXNCK6VYYQ-Ty8xlHnzXatQaFbMf1-0rsY/edit?usp=sharing |
|
451
|
Wed Oct 2 10:31:46 2024 |
Xuesi Ma | Configuration | | Group Meeting Slides 10/2/2024 |
Group Meeting slides for Non-deterministic Heater Response.
|
| Attachment 1: Group_Meeting_10_2.pdf
|

|
|
82
|
Thu Apr 27 21:43:07 2023 |
Jon | Physics | VAC | Grounding vacuum system |
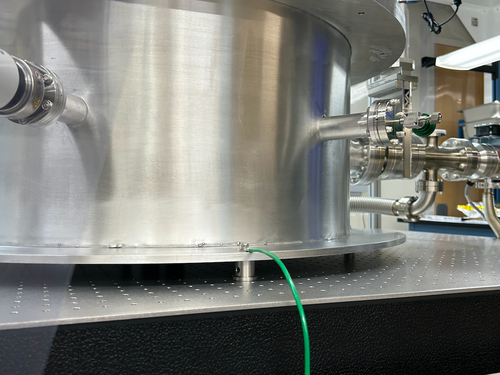
This afternoon I made up a green 10 AWG grounding cable and connected it to the vacuum system.
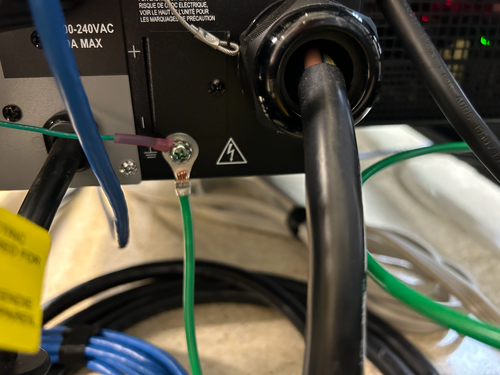
One end is tightly connected to the bottom flange of the vacuum chamber (photo 1). It is run along and up the table framing to the top of the cleanroom, where it exits into the overhead cable tray in the same location as the other power cables. It drops down from the top of the server rack all the way to the bottom, where the other end is connected to the lab's electrical ground in the rear of the 240 V UPS (photo 2).
The connections were confirmed to be secure, but continuity testing with an ohmmeter remains to be done to confirm that the chamber and tabletop are indeed grounded. |
| Attachment 1: IMG_0141.png
|
|
| Attachment 2: IMG_0140.png
|
|
|
84
|
Fri Apr 28 18:16:57 2023 |
Cao | Physics | VAC | Grounding vacuum system |
| Quote: |
This afternoon I made up a green 10 AWG grounding cable and connected it to the vacuum system.
One end is tightly connected to the bottom flange of the vacuum chamber (photo 1). It is run along and up the table framing to the top of the cleanroom, where it exits into the overhead cable tray in the same location as the other power cables. It drops down from the top of the server rack all the way to the bottom, where the other end is connected to the lab's electrical ground in the rear of the 240 V UPS (photo 2).
The connections were confirmed to be secure, but continuity testing with an ohmmeter remains to be done to confirm that the chamber and tabletop are indeed grounded. |
[Cao]
Continuity Test
Following from Jon's grounding work on the vacuum system, I did a continuity test with the afternoon with a multimeter. The chamber is indeed grounded:
- Chamber wall to optical table: continuity confirmed, resistance: 0 Ohm
- Chamber wall to ground point connection on chamber: continuity confirmed, resistance: 0 Ohm
- Turbo pump to ground point connection on chamber: continuity confirmed, resistance: 0 Ohm
- Turbo pump to optical table: continuity confirmed, resistance: 0 Ohm
- Optical table to chassis frame outside cleanroom: continuity confirmed, resistance: 0 Ohm
- Front of chassis frame to earth point: continuity confirmed, resistance: 0 Ohm
|
|
645
|
Tue Sep 16 12:18:09 2025 |
Liu | Update | Interferometer Simulations | Grid search optimization for single-ring FROSTI |
| Grid search optimization for single-ring FROSTI |
| Attachment 1: Update.pdf
|

|
|
187
|
Tue Aug 1 16:22:35 2023 |
Celeste | Update | TCS | Graphical Updates to HOM RH Modification, Tuesday 8/1 |
| Slides 20-33 are newly added (data/graphs from parameter sweep feature-1/8th heater unit length varied from 10% of original to 100% of original). |
| Attachment 1: HOM_RH_Simulation_Progress_80123.pdf
|

|
|
180
|
Fri Jul 28 17:45:45 2023 |
Celeste | Update | TCS | Graphical Updates to HOM RH Modification, Friday 7/28 |
| Updated 1/8th Heater simulation modification graphs. Slides 7, 10, 16-19 are new additions. |
| Attachment 1: HOM_RH_Simulation_Progress.pdf
|

|
|
173
|
Thu Jul 27 10:18:43 2023 |
Celeste | Update | TCS | Graphical Updates to HOM RH Modification |
| Attached are updated graphs of the irradiance distribution from the 1/8th ring heater units (extruded and reduced in length). |
| Attachment 1: HOM_RH_1_8_Unit_Modification_Graphs.pdf
|

|
|
158
|
Sun Jul 16 15:21:56 2023 |
Pamella | Update | General | General update about some problems in the lab. |
[Pamella]
General information about the lab facility.
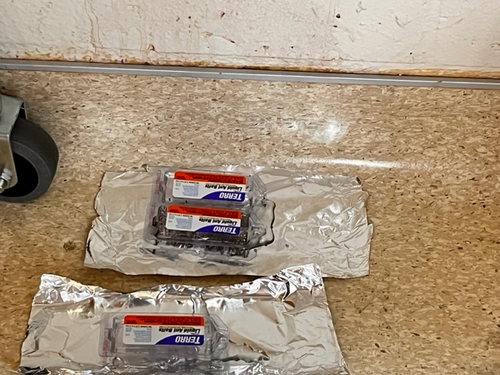
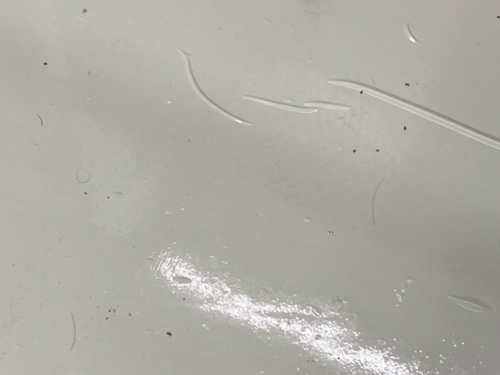
- Changed sticky floor mats, because close to entrance the cleanroom, both sticky floor had a many died ants on top.
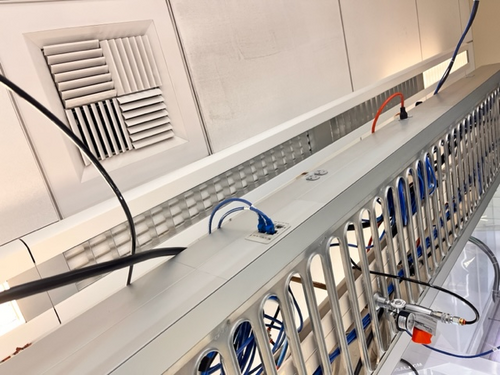
- The light on top of the internet cable bridge is burned out.. I just saw this today but I am not sure if was like this before.
- The ant bait traps seem very efficient and right now only a few ants are running around in the lab, most are dead in the bait traps, so probably in a day or two we can change those bait traps.
|
| Attachment 1: IMG_8637.jpg
|
|
| Attachment 2: IMG_8633.jpg
|
|
| Attachment 3: IMG_8631.jpg
|
|
|
331
|
Tue Feb 20 11:31:49 2024 |
Tyler | Update | Cleanroom | Garment Cabinet Door Replacement |
| [Luis, Luke, Pooyan, Tyler]
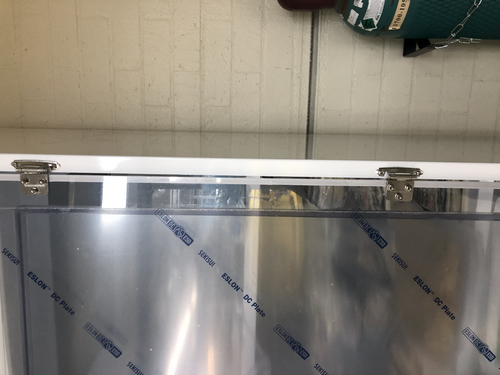
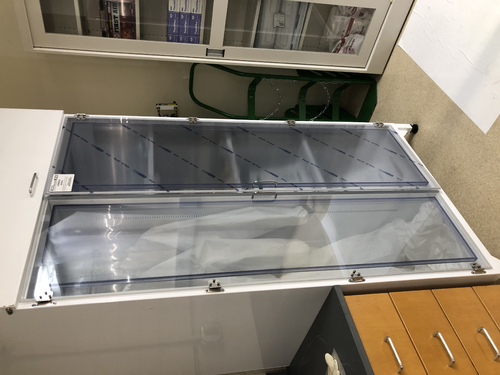
The replacement door for the HEPA garment cabinet arrived last week, and was installed on Thursday. However, it looks like there's a small gap between the door and where the hinge is attached to the cabinet frame. No screws were provided with the replacement door. If we want to perform any adjustments, we have to be very careful; the screws break very easily.
|
| Attachment 1: image_67190529.JPG
|
|
| Attachment 2: image_67177473.JPG
|
|
|
500
|
Tue Jan 21 10:12:02 2025 |
Luke | Summary | General | Frosti toy model |
[Luke, Liu]
Over the winter break I have been working on this desmos toy model of the Frosti. There are still a few rough spots but I belive that it is a good visual representation of a 2D slice of the frosti. |
|
646
|
Tue Sep 16 12:47:29 2025 |
Xuesi Ma | Update | Interferometer Simulations | Frosti actuation impact analysis |
| Slides |
|
389
|
Fri Jun 28 10:43:13 2024 |
Xuejun | Update | Cleanroom | Frosti |
| [Xuejun, Tyler]
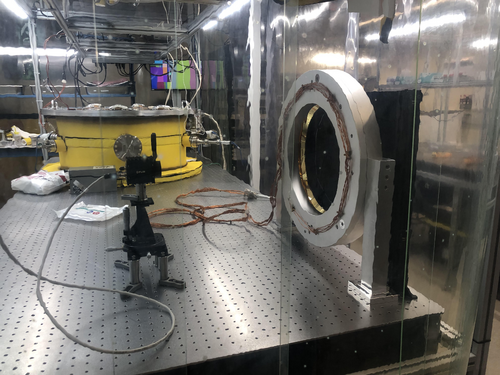
We moved Frosti into the cleanroom and debugged it to make sure everything was working. One of the DB25 pins broke off at the connector for element 1 so it needed to be recrimped. Element 6 short circuited but fixed with adjustment to the heater power pin position. We connected the power and sensor connectors to the power box and recalibrated the RTD sensors.
|
| Attachment 1: frosti.jpg
|
|
| Attachment 2: chassis.jpg
|

|
|
393
|
Fri Jul 5 13:17:44 2024 |
Liu | Update | Interferometer Simulations | Four-quadrant FROSTI-like RH for astigmatic thermal actuation for CE optics |
| In the CE corner layout design and down selection study, interferometer layouts with large incidence angles on some of the curved optics are being considered, such as the folding mirrors in the "long crab". This however generates astigmatic beams upon reflection and results in mode mismatches in coupled cavities that need to be mitigated. Astigmatic thermal actuation for the optics involved is thus essential. One way we are considering is to implement a FROSTI-like barrel RH that delivers different irradiance for the four quadrants. This post summarizes primitive results on the astigmatic thermal actuation for the HR surface by powering the heater elements from one diagonal differently compared to the other.
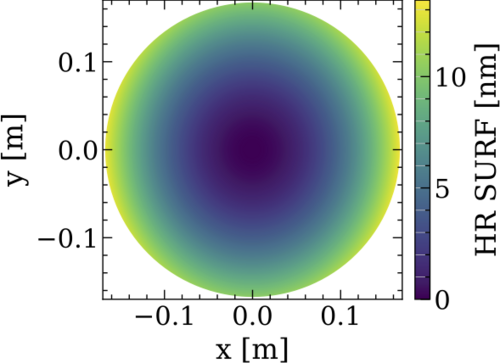
For this study, we looked at a simple case with an aLIGO-like test mass geometry (R=0.17m, H=0.2m) plus a barrel RH with 0.02m width at 0.03m from the AR surface with FEniCSx. The irradiance profiles are constant inside the width along the longitudinal direction, and zero outside the width. For the baseline non-astigmatic actuation with constant irradiance azimuthally. We have obtained roughly equal quadratic actuations along the x and y directions, as shown in figure. The total delivered power on the entire barrel is normalized to 1 W. The actuation on the curvature per power Delta S/Delta P in this non-astigmatic case thus is 0.835 uD/W.
For the astigmatic case however, the irradiance for the regions from one diagonal is increased by a given amount, compared to the non-astigmatic case, whereas for the other diagonal regions is decreased by the same amount (thus the total power is unchanged at 1 W). The HR deformation when the power is changed by 50%, for instance, is shown in picture, where the deformation along the x direction is larger than the y direction. The deformation in each direction however remains quadratic, with different curvature per powers for the x and y components, as shown in plot. The actuation on the curvature per power for an increasing amount of astigmatism is shown in plot. In terms of Zernike polynomials, the maximum amount of Z22 (astigmatism) for 1 W of total power is 2um while the remaining curvature content (Z20) is 6nm. This is shown in plot. |
| Attachment 1: SURF_05.png
|
|
| Attachment 2: SURF_xy.pdf
|

|
| Attachment 3: SURF_dsdp_converge.pdf
|

|
| Attachment 4: SURF_dsdp_astigs.pdf
|

|
| Attachment 5: overlaps_zers.pdf
|

|
| Attachment 6: SURF_xy_nonastig.pdf
|

|
| Attachment 7: SURF_xy_nonastig.pdf
|

|
|
556
|
Mon Apr 21 16:56:42 2025 |
Michael | Update | Interferometer Simulations | Fixed Observed Squeezing Curve for Toroidal Mirror Case |
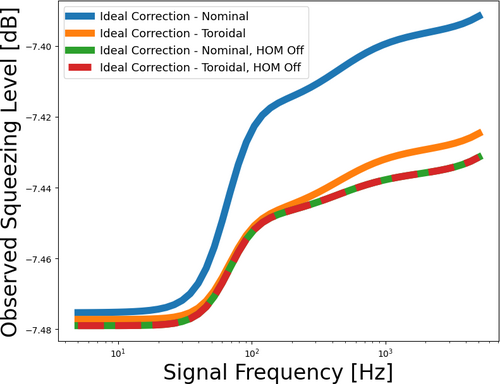
| We've resolved the issue with the observed squeezing curve for the toroidal mirror case showing worse performance at lower frequencies and better performance at higher frequencies compared to the nominal case. This issue was caused by the beam parameter at the squeezer being fixed before changing the radii of curvature of the mirrors. This has been changed to be fixed after changing the mirrors, and we see an improvement in the toroidal mirror case. |
| Attachment 1: updated_observed_squeezing_plot.png
|
|
|
90
|
Tue May 2 17:03:14 2023 |
Jon, Cao | Physics | VAC | First pump-down test of vacuum chamber |
[Jon, Cao]
1. Re-routing of cables
We re-routed the connections between the turbo pump and its fan to the controller. Instead of going through the side of the server rack, they are now routed along the the cable tray and came down from the top of the server rack.
2. Planning for vacuum assembly re-configuration
While preparing for our first pump-down, we notices that RGA pump line gate valve, at its fully closed position, is higher than the height of the chamber lid. The full range gauge attached to the RGA line, while not that high, can also cause obstruction during removal/ installation of the vacuum lid. The calibrated leak, eventhough is now running within the perimeter of the optical table, it stills introduce weak points that are susceptible to damage if personnel installing chamber lid may lean onto it. Thus we made a few suggested modification to the vacuum chamber assembly:
- Move the entire RGA arm to the mirrored CF port, where the Up-to-Air valve is at
- Move the Up-to-Air valve to the calibrated leak port
- Move the calibrated Ar leak the main chamber full-range gauge port
- Move the full-range gauge to the RGA line port
3. First test pump-down
- With all valves closed, we started scroll pump, pump line quickly got down to 6.08 mbar from atmospheric 1000 mbar (measured by Pirani gauge, channel 3 on controller )
- We open Lesker angled valve and let the RGA arm pumped down, Pirani gauge read 6.3 mbar while the full-range guage on RGA line reads 4.9 mbar ( channel 1 on controller )
- We open the pump line gate to expose the pump to the main volume, all gaugues readout immediate rise back up 1000 mbar. After 3 minutes, we started to see channel 3 slowly dropped down. A minute later channel 1 and 2 (main body) also dropped down. The slow pressure dropping speed and 6.3 mbar measured earlier got us suspected that there is some large leaks
- We proceed to tighten all the ports as the vacuum is pumped down. In particular, we found that large feedthrough port still required a lot of tightening up
- As we tighten up all the ports, after 40 minutes, the gauges are now
- Channel 1 : RGA line full-range gauge: 2.55E-1 mbar
- Channel 2 : Main chamber full-range gauge: 2.60E-1 mbar
- Channel 3 : Pump line Pirani gauge: 2.94E-1 mbar
Compare this to the scroll pump manual , Table 1, page 3, the ultimate pressure of the scroll pump is 2.5E-1 Torr (3.3E-1 mbar), we thus managed to achieve scroll pump ultimate pressure
- Turn on turbo pump : Change turbo pump controller from REMOTE to FRONT PANEL mode by pressing both "COUNTERS" and "MEASURE" buttons at the same time, select "MODE=FRONT"
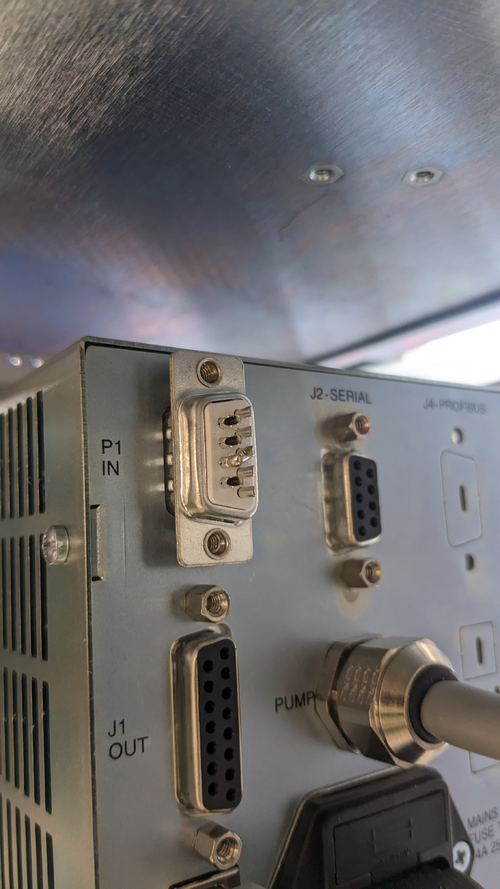
- Shorting interlock pin: since we do not have an interlock signal for the controller, use the provided DB-9 connector that has pin 3 and 8 shorted and connect this to the P1 IN connection at the rear of the controller (see attachment 1 )
- Press "START" on the controller to start the turbo pump
- The pressure readout from the gauges quickly dropped down. After 3 minutes, the Pirani range is maxed out at 0.5E-3 mbar. After 20 minutes, we recorded the following values:
- Channel 1 : RGA line full-range gauge: 1.50E-5 mbar
- Channel 2 : Main chamber full-range gauge: 1.89E-5 mbar
- Channel 3 : Pump line Pirani gauge: 5.0E-4 mbar
This is Medium vacuum , we want to further reduce this by 2 orders of magnitude. However, we can run RGA test + helium leak test at this pressure
- Turn off turbo pump, wait for 10 minutes, turn off scroll pump, open Up-to-Air valve, all pressure gauges indicated pressure returned back to atmospheric pressure
3. To-do actions
- Run RGA test to get information about contamination status of vacuum
- Implement suggested changes in section 2
- Check and modify suspected poor connection: Pirani gauge on pump line. A gap can be seen between connection. There's no good way to tighten it with the screw. Maybe use threaded pin + hex bolt?
- Controller communications
|
| Attachment 1: PXL_20230502_203343616.jpg
|
|
| Attachment 2: PXL_20230502_210234897.MP.jpg
|
|
|
554
|
Tue Apr 15 11:37:17 2025 |
Cynthia | Update | Interferometer Simulations | Finishing up mirror coating map step |
|
| Attachment 1: updates_4_15_2025.pdf
|

|
|
181
|
Fri Jul 28 18:03:07 2023 |
Pamella | Update | FLIR | Final plot - FLIR |
[Pamella]
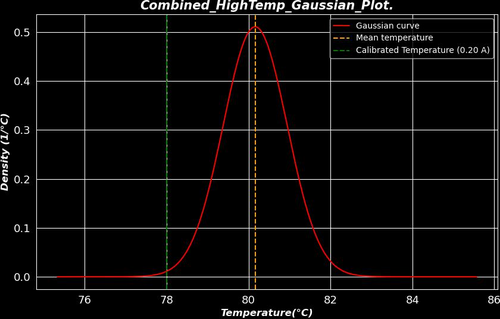
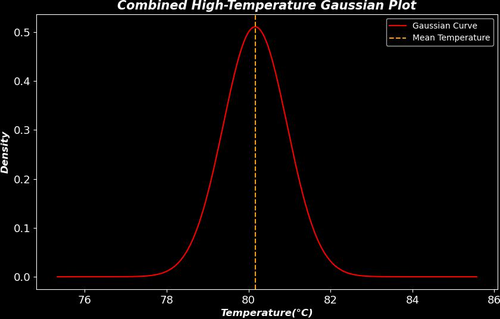
- I was able to plot the final result with the data to the heater. I attached below the "3Combined_HighTemp_Gaussian_Plot." in this plot we can see better behavior on the Gaussian compared to the plot in ELOG 169, I was using the same data but with a different approach. On the ELOG 169, we have the center point isolated data and this new plot is the temperature more than 70 C isolated because we have a very good heater temperature distinguish do background. For the all data I got I was using a power current of 0.20A. To get the data I waited for 30 minutes until the heater became stable and after that, I started to take snaps, I took more than one snap for each one different 6 positions on the screen, and We can see the positions on ELOG 167.
- Also I attached the calibration plot ("calibration_plot") between the measurements with the FLIR camera and thermocouple and we can see looks good if we compare the final plot.
- For better analyses I attached a plot of the calibration line on the Gaussian plot.
- To do: I will finish the final report.
|
| Attachment 1: 29Combined_HighTemp_Gaussian_Plot.jpg
|
|
| Attachment 2: 3Combined_HighTemp_Gaussian_Plot.jpg
|
|
| Attachment 3: calibration_plot(2).png
|
.png.png)
|
|
516
|
Tue Feb 18 10:12:39 2025 |
Tyler | Update | TCS | Final RIN Plot Update |
Below is a preview of the final RIN figure that will be included in the FROSTI instrument paper. A quick summary of what is shown below:
The original RIN CSD measurement is shown on the top panel in red. Frequency bins that exhibit external electronics noise (ex. ADC, photodetector noise, etc.) are identified and shaded in gray. These noisy bins are then excluded from the dataset before beginning the next step in the analysis process: rebinning. Here, the resolution of the spectrum can be changed by averaging frequency bins together within a specified interval, with the goal of pushing the measurement curve closer to the A+ requirement shown in the figure. For demonstration below, the spectrum goes from a resolution of ~0.93 Hz to 14.90 Hz.
|
| Attachment 1: Preliminary_RIN_plot.pdf
|

|
| Attachment 2: FROSTI_ON.pdf
|

|
| Attachment 3: Dark_Noise.pdf
|

|
| Attachment 4: ADC_Noise.pdf
|

|
|
460
|
Wed Oct 16 14:13:31 2024 |
Liu | Update | | FROSTI with non uniform absorption scattering sources |
| Slides |
|
649
|
Tue Sep 30 12:26:15 2025 |
Liu | Update | Interferometer Simulations | FROSTI optimization for A# |
|
| Attachment 1: Update.pdf
|

|
|
347
|
Wed Mar 6 09:57:52 2024 |
Tyler | Update | TCS | FROSTI Wiring |
Upon finishing the FROSTI assembly last week, we ran into some electrical issues. An electrical short was found between two of the d-sub pins (2 and 8). It appears that the pins were somehow coming into contact with the aluminum surrounding them. This was causing the power supply to trip. The issue was seemingly fixed by adjusting the positioning of the cabling leading out of the reflector. When handling the device in the future, please make sure to keep the wiring as undisturbed as possible. The setup is rather fragile, and moving the cabling around could potentially reintroduce a short like this. |
|
601
|
Tue Jul 1 11:04:00 2025 |
Christina | Update | TCS | FROSTI Reconstruction II |
[Ma, Tyler, Christina]
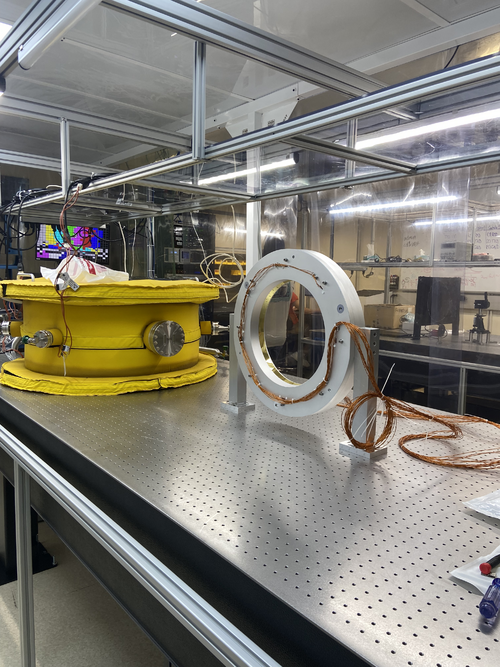
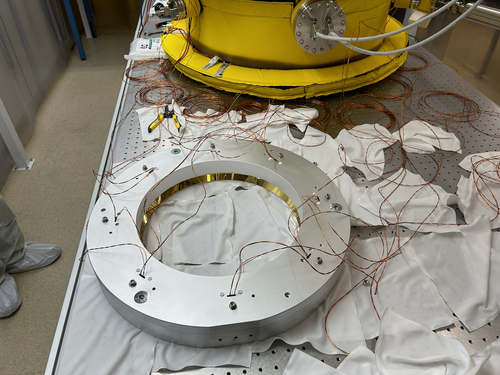
Finished external reconstruction of the FROSTI by installing all the pins to the 2 DB 25 connectors. To ensure everything was operating correctly, we did electrical testing by testing continuity and by checking each of the heater elements' RTD and power resistance values and comparing them to what was tabulated in January. Additionally, we organized the wires and added the stands. |
| Attachment 1: IMG_4042.png
|
|
|
600
|
Fri Jun 27 15:38:22 2025 |
Christina | Update | TCS | FROSTI Reconstruction |
[Tyler, Ma, Christina, Luke]
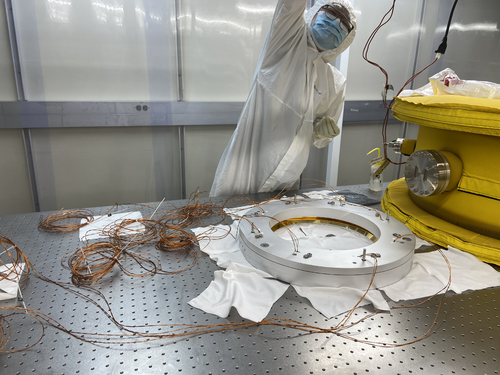
We threaded the wiring of the heater elements through the reflective surfaces and were able to attach each piece with the Macor spacers and connect both sides. We used the guide rails and screws to ensure proper alignment. The only necessary step left is to add the additional external screws for the reconstruction. |
| Attachment 1: IMG_4009.png
|
|
|
492
|
Wed Dec 18 15:41:56 2024 |
Tyler | Update | TCS | FROSTI RIN |
| [Tyler]
I have begun the (hopefully) final RIN measurements at 3:30 PM today. If you need to go into the cleanroom at any time between now and Sunday (the 22nd), please do not touch the FROSTI, the Red Pitaya, the photodetectors, or any of the wiring. |
|
352
|
Sun Mar 24 11:49:27 2024 |
Aiden | Update | General | FROSTI RGA Scan |
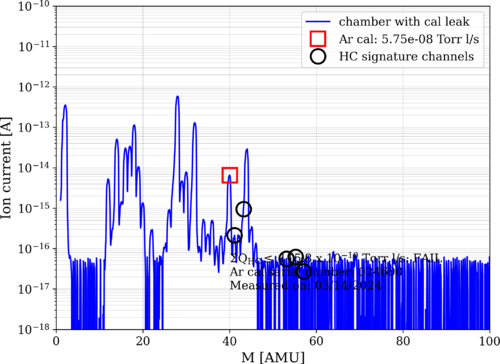
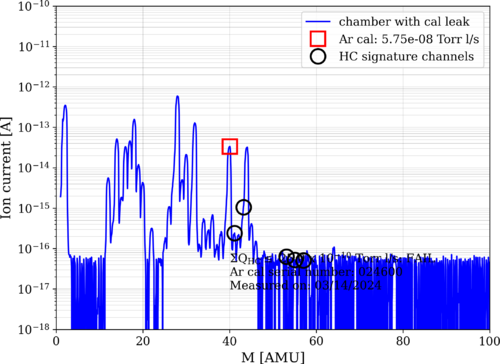
| Took RGA data 1 day after the conclusion of Bake 13. Bake 13 ended on Saturday March 23, the RGA data shown was taken on Sunday March 24. The scan shows that the FROSTI is very clean with no outgassing. The HC levels are at 25 e-10. The pressure in the chamber was also a 1.64 e-8 Torr. |
| Attachment 1: bake13_240324_FROSTI_ArC.png
|
|
| Attachment 2: bake13_240324_FROSTI_ArO.png
|
|
|
499
|
Fri Jan 17 13:27:07 2025 |
Tyler | Update | TCS | FROSTI Pre-disassembly |
| [Tyler, Ma, Cece, Jon, Luke, Cynthia, Michael]
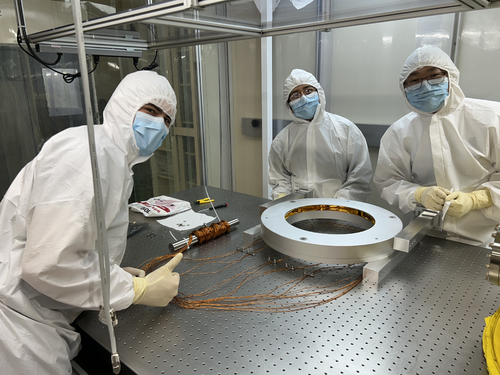
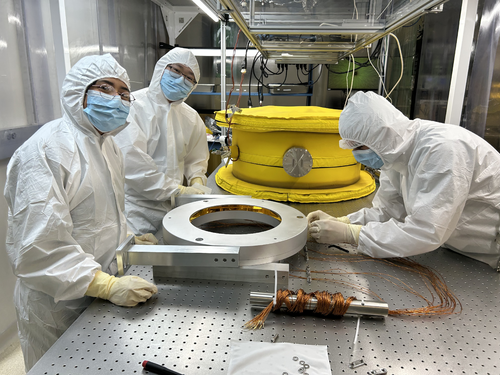
On Tuesday, we prepared the FROSTI for disassembly in anticipation of the APS filming that is set to take place in the labs. The FROSTI has been unbolted from the optical table in the cleanroom, with its wires weighted down and the majority of its screws removed to ensure an easy removal of the reflectors during the filming process.
|
| Attachment 1: IMG_1828.jpeg
|
|
| Attachment 2: IMG_1830.jpeg
|
|
|
350
|
Tue Mar 19 15:22:27 2024 |
Aiden | Update | Clean & Bake | FROSTI Legs Clean and Bake |
| [Aiden, Luke]
Cleaned and baked the Cal Tech FROSTI legs and showed Luke the procedure on how to clean parts. |
|
455
|
Wed Oct 2 14:49:59 2024 |
Liu | Update | | FROSTI ETM actuation |
| Proposed FROSTI ETM actuation on the HOM7 resonance.
Animation |
|
501
|
Wed Jan 22 10:50:08 2025 |
Tyler | Update | TCS | FROSTI Disassembly |
| [Tyler, Ma, Cece, Luis, Shane, Luke, Cynthia, Liu, Jon]
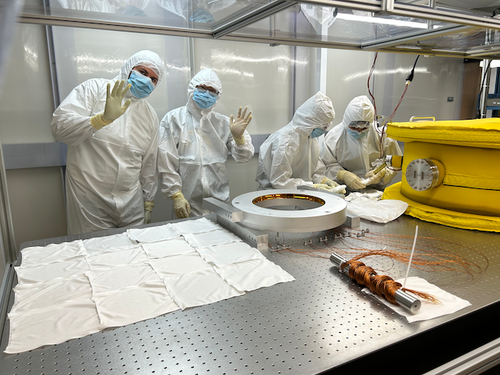
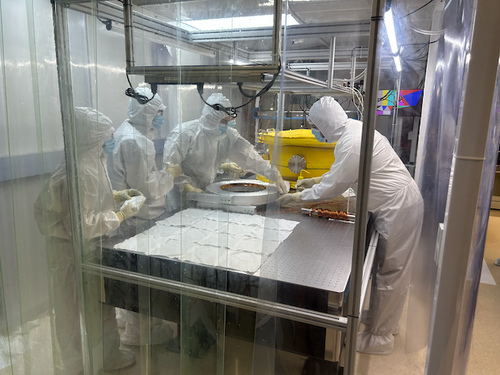
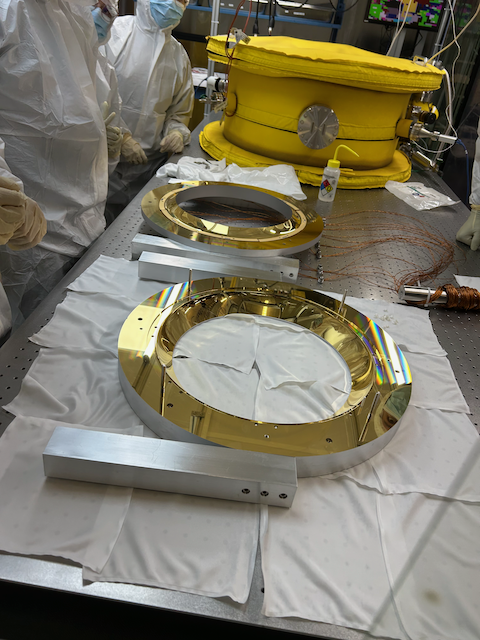
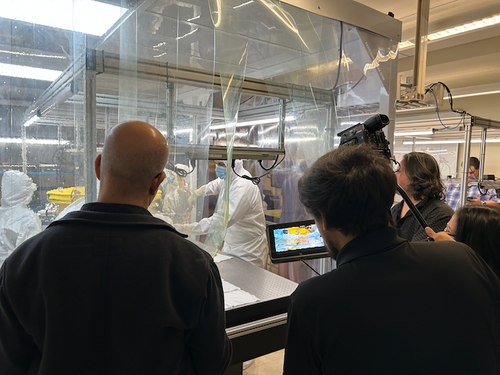
On Tuesday (Jan 21), we took the FROSTI apart in front of a filming crew. It was a success! The footage is going to be used in an APS video detailing the experimental cosmology research conducted in the department.
The FROSTI reflectors, heater elements, and legs were all bagged separately and a currently being stored in the cleanroom. If you need to do any work in there, please be mindful of these parts. The elements are currently on the shelf above the optical table, and the reflectors are placed on the table in the back corner. |
| Attachment 1: IMG_1843.png
|
|
| Attachment 2: IMG_1844.png
|
|
| Attachment 3: IMG_1849.png
|
|
| Attachment 4: IMG_1850.png
|
|
|
291
|
Mon Dec 11 16:20:17 2023 |
Jon | Summary | TCS | FROSTI Assembly Procedure |
Below is the procedure we will follow to assemble the FROSTI prototype.
- Install SS guide rods and bottom Macor spacers in bottom reflector
- Install AlN elements on top of bottom Macor spacers
- Install upper Macor spacers on top of AlN elements
- Feed unterminated power and RTD leads through slots in upper reflector
- Install upper reflector, using guide rods to slowly lower into position
- Install vented SS bolts for reflectors; Macor bolts for heater elements
- Remove SS guide rods
- Bundle power and sensing cable with PEEK cable ties and SS cable mounts
- Terminate power and sensing cable bundles with PEEK DB25M connectors
|
|
345
|
Wed Feb 28 17:49:18 2024 |
Tyler | Update | TCS | FROSTI Assembly - Days 2-3 |
| [Aiden, Jon, Luis, Luke, Michael, Tyler]
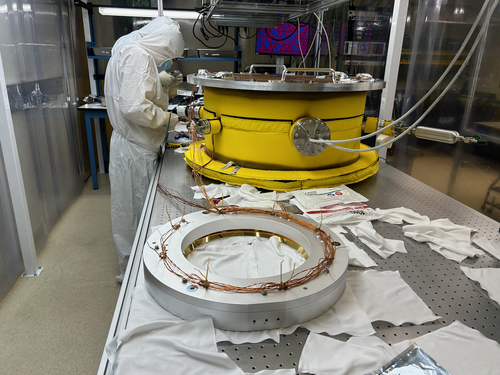
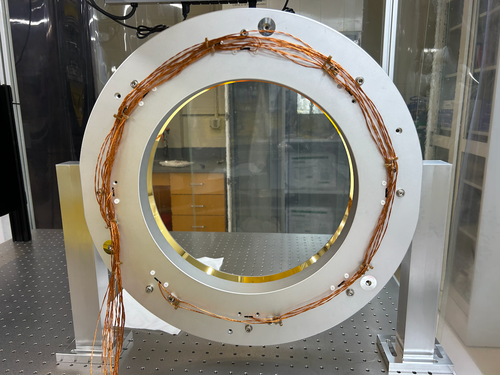
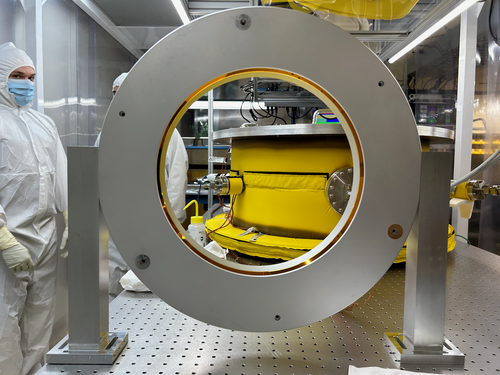
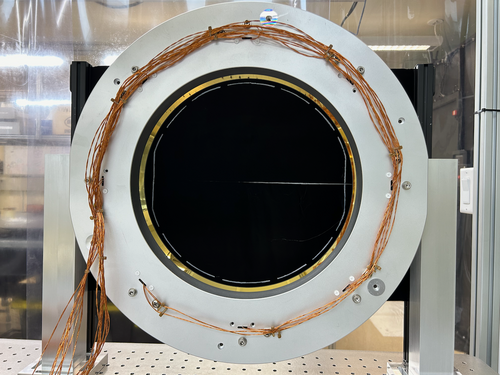
FROSTI assembly was completed today. The RTD and power wires were terminated at the DB-25 connectors and the legs were put on. It is currently placed in front of the stand-in test mass (~5 cm away). The FLIR has also been moved back to it's nominal position. As of now, it appears there are some shorts within the power cabling. This will be a focus of tomorrow's work.
| Quote: |
| [Jon, Tyler, Luis, Luke, Mohak, Cynthia, Michael, Aiden]
FROSTI assembly began today. After a final set of RGA scans were taken, the vacuum chamber was vented and the reflectors were removed. The chamber was then resealed and pumped down again.
Today we completed the installation of the Macor hardware and heater elements between the two reflector halves. Tomorrow we will route, bundle, and terminate the power and sensor cables. |
|
| Attachment 1: IMG_0947.png
|
|
| Attachment 2: IMG_0956.png
|
|
| Attachment 3: IMG_0957.png
|
|
| Attachment 4: IMG_0959.png
|
|
|
341
|
Mon Feb 26 21:23:27 2024 |
Jon | Update | TCS | FROSTI Assembly - Day 1 |
| [Jon, Tyler, Luis, Luke, Mohak, Cynthia, Michael, Aiden]
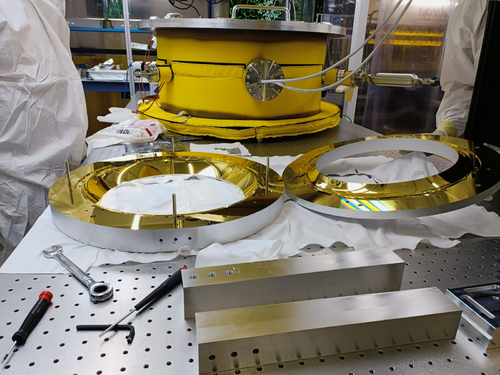
FROSTI assembly began today. After a final set of RGA scans were taken, the vacuum chamber was vented and the reflectors were removed. The chamber was then resealed and pumped down again.
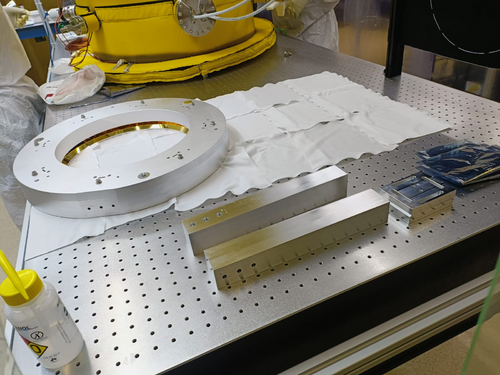
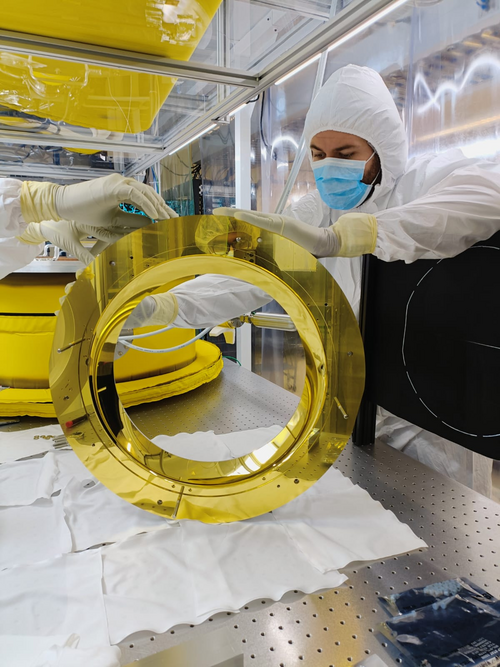
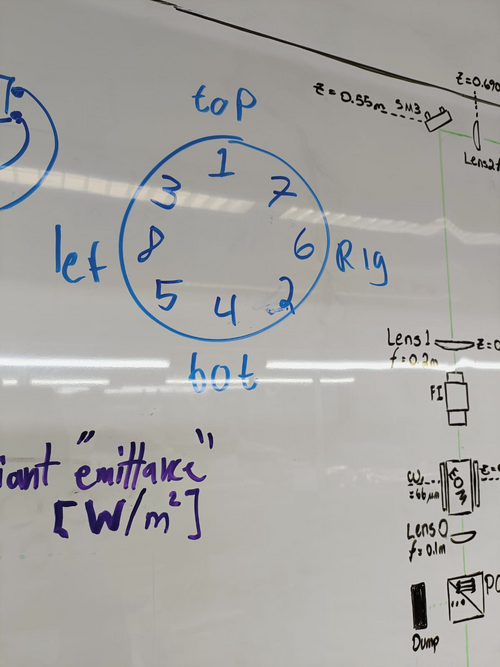
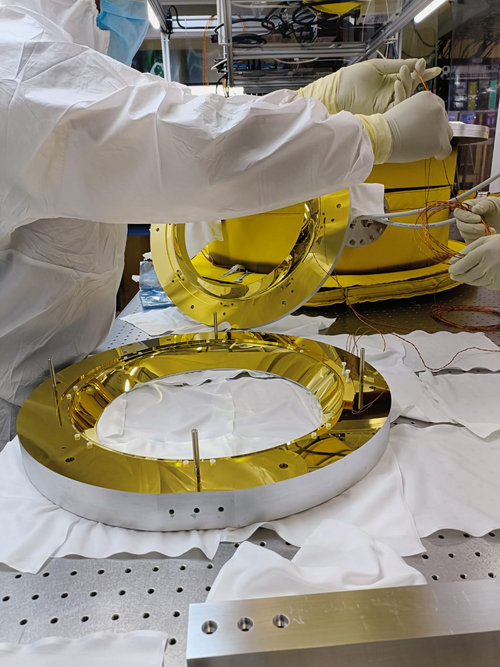
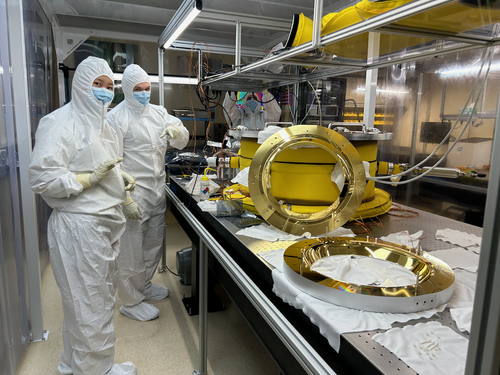
Today we completed the installation of the Macor hardware and heater elements between the two reflector halves. Tomorrow we will route, bundle, and terminate the power and sensor cables. |
| Attachment 1: IMG-20240226-WA0008.jpg
|
|
| Attachment 2: IMG-20240226-WA0006.jpg
|
|
| Attachment 3: IMG-20240226-WA0011.jpg
|
|
| Attachment 4: IMG-20240226-WA0010.jpg
|
|
| Attachment 5: IMG-20240226-WA0012.jpg
|
|
| Attachment 6: IMG_0944.png
|
|
| Attachment 7: IMG_0946.png
|
|
|
542
|
Tue Mar 25 12:56:47 2025 |
Tyler | Update | TCS | FROSTI Analysis Finalization |
Upon final review of the FROSTI analysis included in the (hopefully) soon-to-be submitted instrument paper, I've made some adjustments to the reflectivity analysis that estimates the amount of power delivered to the test mass by the FROSTI. Initially, as detailed in elog 447, the delivered power was approximated to be 12.6 W (later adjusted to 12.9 W), with roughly 18% of this power being reflected by the test mass. After some final adjustments, this value now is closer to 12.0 W, with 10.2 W absorbed (15% power reflection). Below is a table showing the updated values for the FROSTI prototype tests:
|
Old Value |
New Value |
| Delivered Power |
12.9 W |
12.0 W |
| Absorbed Power |
10.6 W (18% reflectivity) |
10.2 W (15% reflectivity) |
| Measured Peak Temperature Difference |
5.39 +/- 0.03 K |
5.26 +/- 0.03 K |
| Model Peak Temperature Difference |
5.42 K |
5.21 K |
| Measured Peak OPD |
765 +/- 9 nm |
771 +/- 7 nm |
| Model Peak OPD |
630 nm |
654 nm |
|
| Attachment 1: FROSTI_OPD_profile.pdf
|

|
| Attachment 2: FROSTI_temperature_profile.pdf
|

|
|
622
|
Tue Aug 5 12:21:04 2025 |
Liu | Update | Interferometer Simulations | FROSTI A# optimization |
| A# multi-ring FROSTI optimization |
| Attachment 1: Update.pdf
|

|
|
667
|
Thu Jan 8 12:51:03 2026 |
Tyler | Update | TCS | FROSTI A# Update 01/08/2026 |
| Slides |
|
669
|
Thu Jan 15 13:52:55 2026 |
Xuesi Ma | Update | TCS | FROSTI A# Reflector Update |
| Slides |
|
665
|
Thu Dec 4 12:10:19 2025 |
Tyler | Update | TCS | FROSTI A# Profiles and Element Width Optimization |
| Slides |
|
666
|
Thu Dec 18 12:51:13 2025 |
Tyler | Update | TCS | FROSTI A# Profiles Update |
| Slides |
|
664
|
Thu Nov 20 13:54:34 2025 |
Tyler | Update | TCS | FROSTI A# Optimization and Mesh Convergence Analysis |
| Attached below are slides discussing FROSTI A# Irradiance optimization and mesh convergence analysis for penetration depth. |
| Attachment 1: Updates_11_19_2025-3.pdf
|

|
|
118
|
Mon Jun 12 12:15:10 2023 |
Pamella | Update | FLIR | FLIR- Take data in the closest point. |
[Pamella]
- Used the closest point possible for the reflector in front of the FLIR camera.
- 11:32 am : Turned on the electronic device (current on) for started taking data.
- 11:50 am: Started checking the temperature and the parameters.
- 12:04 pm: Started taking snap after waited for 30 minutes with the current on. Parameters: Current: 0.13A , Volt: 1.8V and Temperature: 51.4 C.
- Note: This snap is in the most close point possible, after that I should be change the reflector position and also the optical focus distance in the FLIR camera.
We can see, in the photo attached below, thought in this closest position the cable connect to reflector is a bit problem to take a good snap also the have issues to keep very uniform triangles (temperature) in the reflector.
- To do: I'll change the position on the light inside to see if the problem it is in the focal point inside the reflector (mirror).
|
| Attachment 1: AcquisitionImage(Jun-12-2023_12_04).jpg
|
.jpg.png)
|
|
112
|
Wed May 31 16:55:55 2023 |
Pamella | Update | FLIR | FLIR- Focus distance |
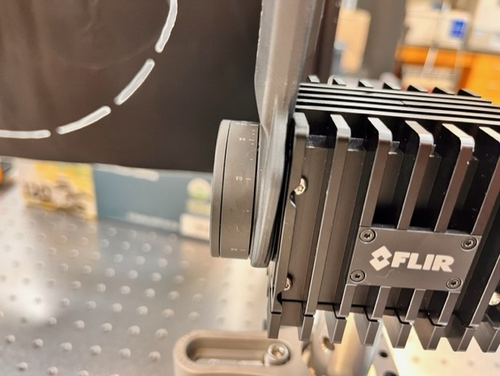
[Pamella and Tyler]
- We changed the FLIR Focus Distance for around 0.55 m.
- Note: The old focus distance was 1.3 m.
- We tested this new focus distances and looks good. I attached a snap below.
Parameters: 0.1 A , 1.5 V and 38.4 C.
|
| Attachment 1: AcquisitionImage(May-31-2023_16_40).jpg
|
.jpg.png)
|
| Attachment 2: thumbnail_IMG_7310.jpg
|
|
|
117
|
Thu Jun 8 14:51:58 2023 |
Pamella | Update | FLIR | FLIR- Distance |
[Pamella, Tyler]
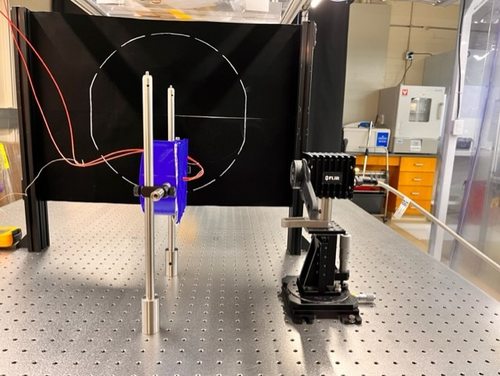
- Today we change the distance between the FLIR camera and reflector (3D-Mask with mirrors and light). Now the distance is 0.2032 m.
- Note: This distance is just for take a snap most close possible but we need move again for a little far way because in this distance we can't move up and down the reflector for have data to compare.
|
| Attachment 1: AcquisitionImage(Jun-08-2023_14_33).jpg
|
.jpg.png)
|
| Attachment 2: thumbnail_IMG_7441.jpg
|
|
|
106
|
Wed May 24 14:06:27 2023 |
Pamella | Update | FLIR | FLIR project - Tests |
[Pamella]
Initial tests
- 10:30 am : Started trying take some test with the new position/configuration between the 3D reflector-mask and the FLIR camera.
- 10:41 am : Started running the python code and take a snap. Parameters: 0.10 A, 1.4 V.
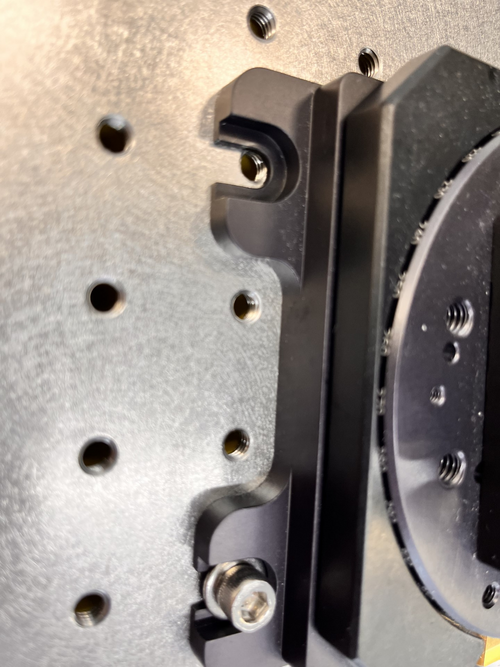
- 10:50 am : Started take the snap.It is possible see the triangles, this is a good thing. Negative thing: The middle/center point for the light maybe would be some problems for the future measurements. Parameters: 0.10A, 1.4 V and 41 C.
- 11:00 am : Started working to better align the entire structure. And double-check the distance between the 3D reflector-mask and the FLIR camera, following the instructions in Cassidy's Final FLIR Project Report.
- 11:10 am : Difficult point: I tried to attach the complete FLIR camera to the table, but I had a problem to secure the four screws to the table, the distance is not completely compatible with the table stand. Yesterday I just put two screws in the diagonal position, it works fine, but it's not the correct position to work.
- 12:00 am : Note: Two triangles take more long time to come back a not (low) irradiation position (east and south point).
- 2:00 pm : Started running the python code again.
- Parameters: 0.13 A 1.8 V.
- 2:30 pm: Started take snap. Parameters: 0.13 A, 1.8 V and 49.1 C
- 3:00 pm: Note: This time every triangles was able to come back a low irradiation position.
|
| Attachment 1: AcquisitionImage(May-24-2023_10_50).jpg
|
.jpg.png)
|
| Attachment 2: thumbnail_IMG-7146.jpg
|
|
| Attachment 3: AcquisitionImage(May-24-2023_14_30).jpg
|
.jpg.png)
|
|
113
|
Thu Jun 1 14:41:36 2023 |
Pamella | Update | FLIR | FLIR project - Test without the black wall. |
[Pamella]
Test without the black wall.
General test:.
- 11:15 am : Started running the code. Parameters: 0.11 A, 1.9V and focus distance around 0.55m.
- 11:28 am : Started snapping the screen. Parameters: 0.12 A, 1.8V and 44.1 C .
First trying:
- 01:18 pm : Started testing and collection data. Parameters: 0.09 A, 1.4V. Reference position: (0,0).
- 01:28 pm : Started snapping the screen. Parameters: 0.10 A, 1.5V and 37.9 C. Reference position: (0,0).
Second trying:
- 01:34 pm : Started testing and collection data. Parameters: 0.08 A, 1.4V. Reference position: (0,-0.10).
- 01:44 pm : Started snapping the screen. Parameters: 0.09 A, 1.7V and 35.8 C. Reference position: (0,-0.10).
Third trying:
- 01:50 pm : Started testing and collection data. Parameters: 0.08 A, 1.3V. Reference position: (0,-0.05).
- 02:00 pm : Started snapping the screen. Parameters: 0.09 A, 1.4V and 35.4 C. Reference position: (0,-0.05).
Fourth trying:
- 02:04 pm : Started testing and collection data. Parameters: 0.09 A, 1.3V. Reference position: (0,0.05).
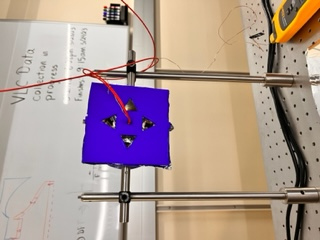
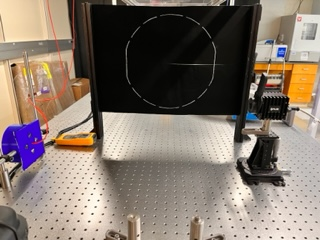
- 02:14 pm : Started snapping the screen. Parameters: 0.11 A, 1.6V and 41.7 C. Reference position: (0,0.05).
Note: So today i tried collecting data for every possible position in Y (height) way for starting analyses and compares the triangles shapes. I realize maybe we get a problem because i keep the same time in every try but the final temperature and the parameters change every time, so i will try do a better system to keep the parameters equal, maybe i can wait the reflector be back to a normal temperature after every test or keep the system on all the time and just change the reflector position. I pretty sure this was the problem.
|
| Attachment 1: thumbnail_IMG_7316.jpg
|
|
| Attachment 2: AcquisitionImage(Jun-01-2023_14_14).jpg
|
.jpg.png)
|
| Attachment 3: thumbnail_IMG_7320.jpg
|
|
|
114
|
Fri Jun 2 14:28:40 2023 |
Pamella | Update | FLIR | FLIR project - Test without the black wall. |
[Pamella]
Test without the black wall.
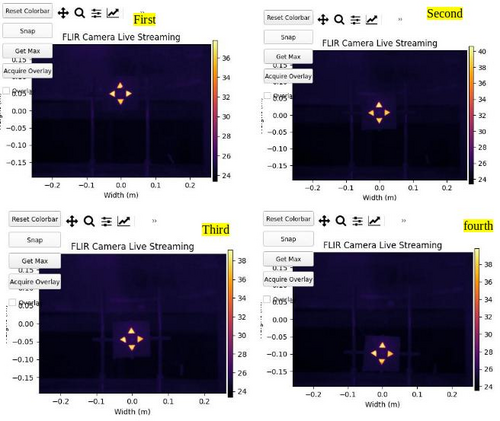
Note: So today i collected data for some positions in axis Y (height) for starting analyses and compares the triangles shapes. I tried keep the same parameters every time.
First position:
- 01:20 pm : Started testing and collection data. Parameters: 0.10 A, 1.6V. Reference position: (0,0.05).
- 01:30 pm : Started snapping the screen. Parameters: 0.10 A, 1.6V and 37.7 C. Reference position: (0,0.05).
Second position:
- 01:34 pm : Started testing and collection data. Parameters: 0.10 A, 1.6V Reference position: (0,0).
- 01:44 pm : Started snapping the screen. Parameters: 0.10 A, 1.6V and 40.6 C. Reference position: (0,0).
Third position:
- 01:50 pm : Started testing and collection data. Parameters: 0.10 A, 1.6V. Reference position: (0,-0.05).
- 02:00 pm : Started snapping the screen. Parameters: 0.10 A, 1.6V and 39.1C. Reference position: (0,-0.05).
Fourth position:
- 02:03 pm : Started testing and collection data. Parameters: 0.10 A, 1.6V. Reference position: (0,-0.10).
- 02:13 pm : Started snapping the screen. Parameters: 0.10 A, 1.6V and 39.6 C. Reference position: (0,-0.10).
|
| Attachment 1: 1Axis_y___tests.jpg
|
|