| ID |
Date |
Author |
Type |
Category |
Subject |
|
156
|
Fri Jul 14 14:37:25 2023 |
Aiden | Update | VAC | VAC System Heating Update |
Checked on the vacuum system and it looks like it will either need to be increased in temperature or baked for a longer time. The main body is at 146C while the cross is at 91C.
|
|
157
|
Fri Jul 14 16:49:42 2023 |
Pamella | Update | FLIR | New bridge and calibration data |
[Pamella]
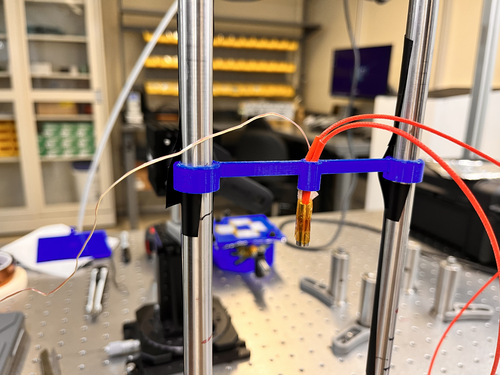
Aiden 3D printed a new bridge for the heater and I installed the new bridge yesterday.
I started collecting data to plot a calibration with the heater. I'm doing measurements with current and the thermocouple (thermometer) to compare with FLIR measurements and have a good calibration. |
| Attachment 1: IMG_8606.jpeg
|
|
|
158
|
Sun Jul 16 15:21:56 2023 |
Pamella | Update | General | General update about some problems in the lab. |
[Pamella]
General information about the lab facility.
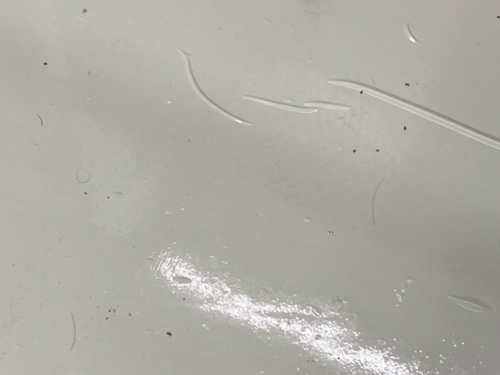
- Changed sticky floor mats, because close to entrance the cleanroom, both sticky floor had a many died ants on top.
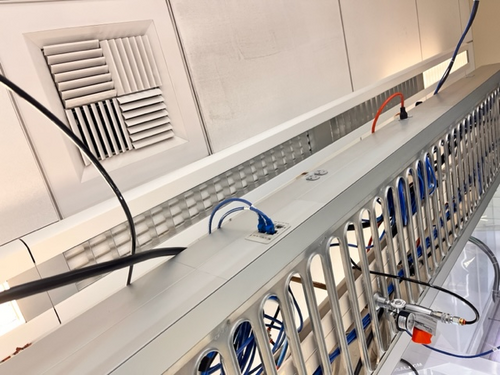
- The light on top of the internet cable bridge is burned out.. I just saw this today but I am not sure if was like this before.
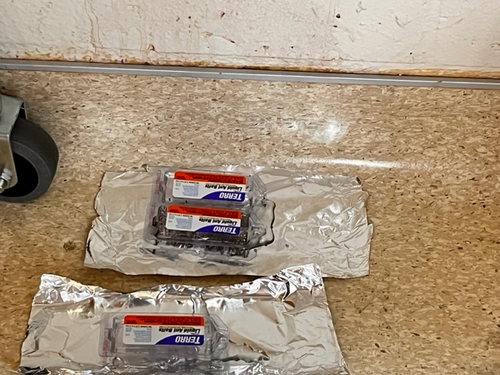
- The ant bait traps seem very efficient and right now only a few ants are running around in the lab, most are dead in the bait traps, so probably in a day or two we can change those bait traps.
|
| Attachment 1: IMG_8637.jpg
|
|
| Attachment 2: IMG_8633.jpg
|
|
| Attachment 3: IMG_8631.jpg
|
|
|
159
|
Mon Jul 17 11:46:24 2023 |
Pamella | Update | FLIR | Thermocouple plot. |
[Pamella]
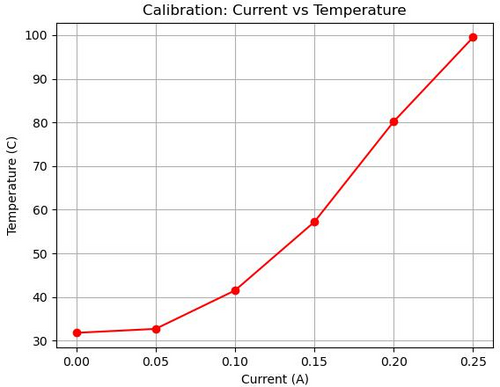
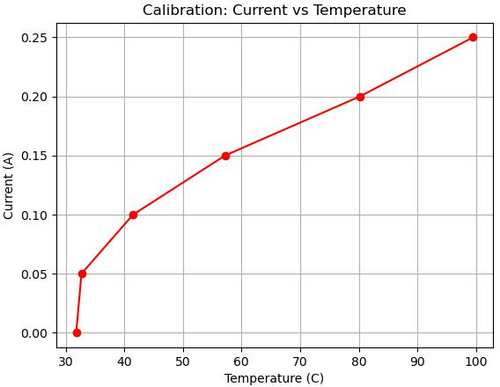
- I collected data to plot a calibration with the heater. I took measurements with current and temperature (the thermocouple - thermometer) to compare with the FLIR measurements.
- I made a plot with this data and we can see how temperature vs current behaves.
Note: This data I measured manually.
|
| Attachment 1: calibration_plot-2.jpeg
|
|
| Attachment 2: calibration_plot-3.jpeg
|
|
|
160
|
Mon Jul 17 13:50:41 2023 |
Aiden | Update | VAC | VAC System Heating Update |
Started to cool down the chamber today. Final temperature readings of the chamber were 146C and 91C for the body and cross respectively.
|
|
161
|
Mon Jul 17 14:01:41 2023 |
Aiden | Update | VAC | VAC System Heating Update |
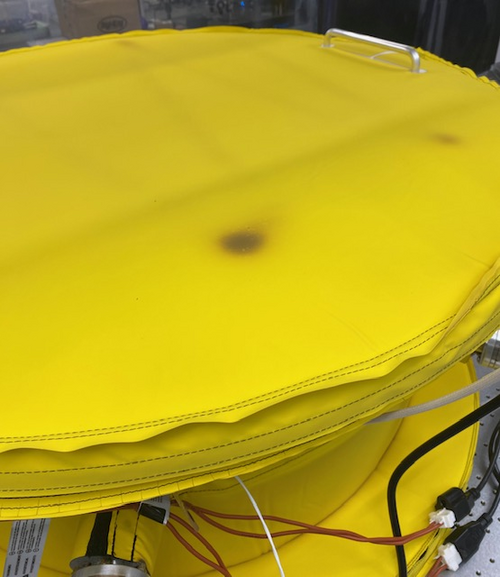
The insulation on the lid of the vacuum chamber has some discoloration and it may be wise to place a sensor closer to this spot in future bakes.
|
| Attachment 1: IMG_4535.jpg
|
|
|
162
|
Tue Jul 18 14:13:46 2023 |
Sophia | Update | Scripts/Programs | Update on Laser Noise Data Collection and Analysis |
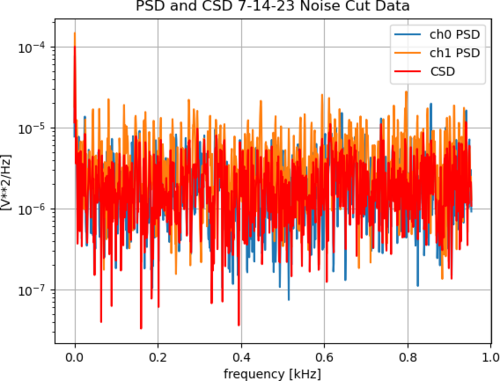
| We [Sophia and Tyler] have found a code which will partition our data and generate PSD's and CSD's automatically. We are now in the stage of writing this into a dynamic code, which so far has been fast-paced because of the framework we have built for it over the past few weeks.
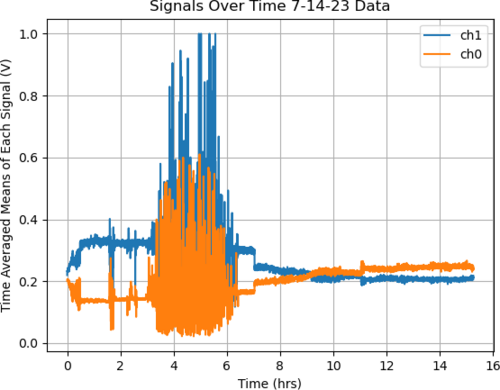
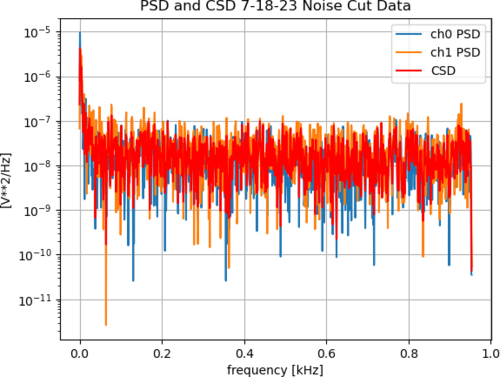
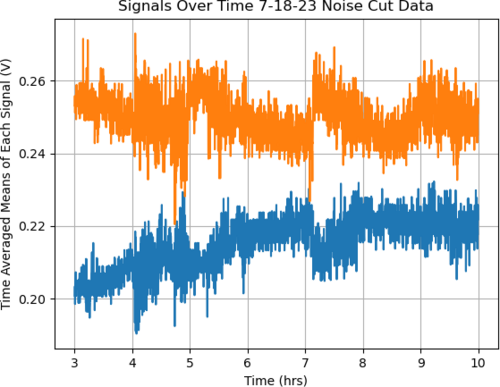
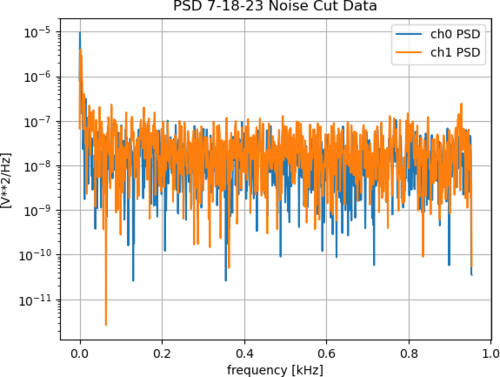
Something to note is that we have found, especially over long periods of time, the laser goes through periods of extreme noise and the signals often cross from where we set them at some point throughout our data collection. We have made the assumption that this is something to do with the laser itself, and not our setup or surrounding space because of both the times that these noise/intensity spikes took place and the duration of the spikes (1.5-2.5 hours). To try and correct for this, we have been "cutting" the noise, and just looking at sections which don't include these big fluctuations. An example of the "noise cut data" is shown in the graph titled "Signals Over Time 7-18-23 Noise Cut Data" and all of the PSD/CSD graphs have been made using only these "noise cut" regions. |
| Attachment 1: 7_14_23_cut_analyzed_graph.png
|
|
| Attachment 2: 7_14_23_raw_graph.png
|
|
| Attachment 3: 7_18_23_cut_analyzed_graph.png
|
|
| Attachment 4: 7_18_23_raw_graph_(1).png
|
.png.png)
|
| Attachment 5: 7_18_23_cut_raw_graph.png
|
|
| Attachment 6: 7_18_23_cut_just_PSD_analyzed_graph.png
|
|
|
163
|
Tue Jul 18 16:04:26 2023 |
Pamella | Update | FLIR | Setup FLIR with black wall (black body) |
[Pamella]
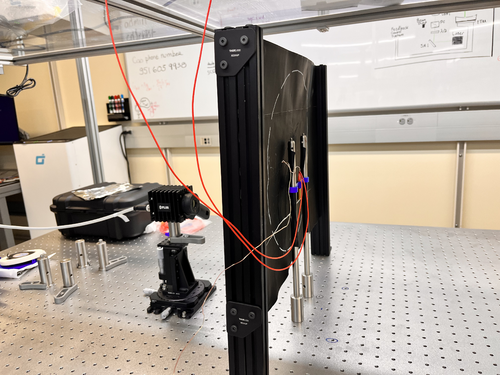
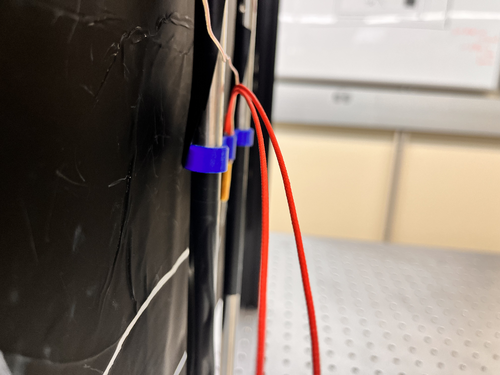
- Today I tried get data the heater with the black screen but doesn't looks possible have just one "energy" point straight to FLIR camera. Tyler and I tried different current and temperatures but keep very bad data. I attached a snap below.
- I attached a photo about the new setup below. The FLIR is in the most close point possible/safety with the heater. The heater is very close to the black wall but is not touch the screen so is safety.
|
| Attachment 1: AcquisitionImage(Jul-18-2023_15_24).jpg
|
.jpg.png)
|
| Attachment 2: IMG_8721.jpeg
|
|
| Attachment 3: IMG_8722.jpeg
|
|
|
164
|
Tue Jul 18 16:12:27 2023 |
Pamella | Update | FLIR | Thermocouple plot. |
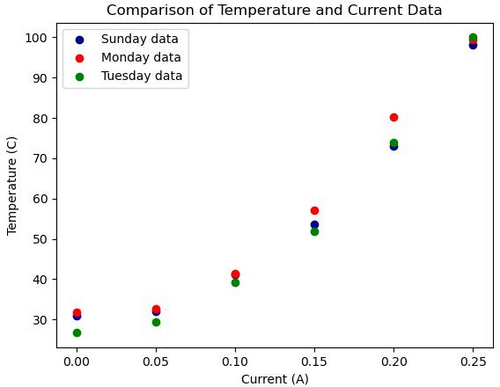
- I noticed that these measurements have some issues with the weather on different days. We can see in the photo attached below how different the temperatures are on different days, I took the data with the same procedure every day, but we can see the differences between them.
- To Do: I will do a new data collection using FLIR and thermocouple at the same time to plot comparison between both.
| Quote: |
[Pamella]
- I collected data to plot a calibration with the heater. I took measurements with current and temperature (the thermocouple - thermometer) to compare with the FLIR measurements.
- I made a plot with this data and we can see how temperature vs current behaves.
Note: This data I measured manually.
|
|
| Attachment 1: Comp.plot.jpeg
|
|
|
165
|
Tue Jul 18 16:35:06 2023 |
Pamella | Update | FLIR | Plot-Data with the new configuration without the mask and reflector. |
[Pamella]
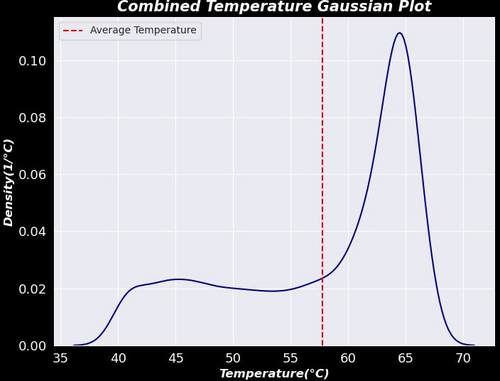
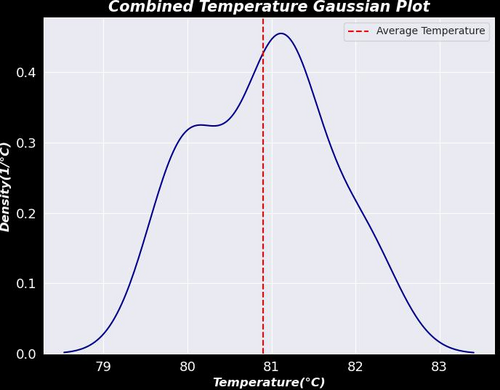
- I was able to plot the first graph for a result between the six different positions on the screen, for now we can see the behavior of the heater temperature in a Gaussian graph with combination data between the six files.
- To do: Tyler gave me some ideas today to improve the plot. So I'm going to change the code to have insulation on the values for just the heater ("insulation") and I'm going to plot after this insulation data as well I'm going to get more data and compare with more data for the same position.
- I was using the data than I got last week and I shared on Elog (151) and we can see on this quote
| Quote: |
| [Pamella]
I started collecting data by moving the camera FLIR and covering all six positions on the screen (2x3). I was looking and taking snaps for more than one hour and a half. I'll repeat this one more time to make sure we have enough data to do analysis.
I attached snap data below. This images is processed on python code. |
|
| Attachment 1: Gauss.plot.jpeg
|
|
|
166
|
Wed Jul 19 14:39:19 2023 |
Pamella, Shane, Aiden | Update | Cleanroom | cleaning and particle count |
|
[Pamella, Shane, Aiden]
cleaning cleanroom and particle count
- 1:10 pm: started particle count
- 1:30 pm: began surface check and wipedown
- 1:41 pm: started vacuuming the floor
- 1:55 pm: finished vacuuming the floor
- 1:57 pm: started mopping the floor
- 2:01 pm: finished mopping the floor
- 2:02 pm: started cleaning the buckets
- 2:08 pm: started mopping with IPA wipes
- 2:17 pm: finished mopping with IPA wipes
- 2:18 pm: changed sticky floor mats
- 2:19 pm: started particle count
|
|
167
|
Wed Jul 19 19:10:31 2023 |
Pamella | Update | FLIR | Data plot FLIR and updates. |
[Pamella]
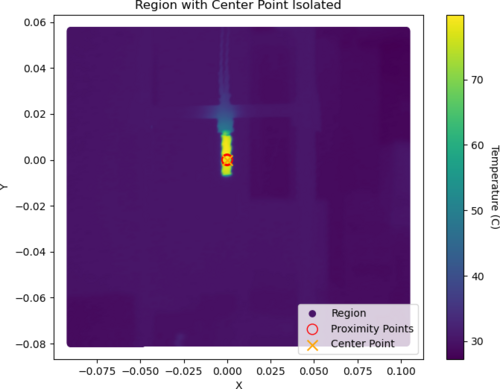
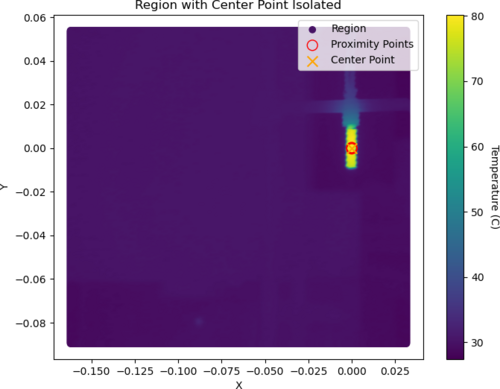
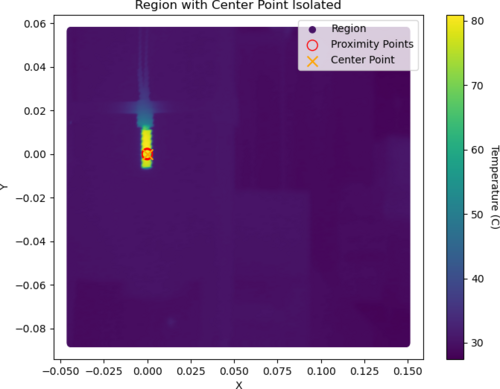
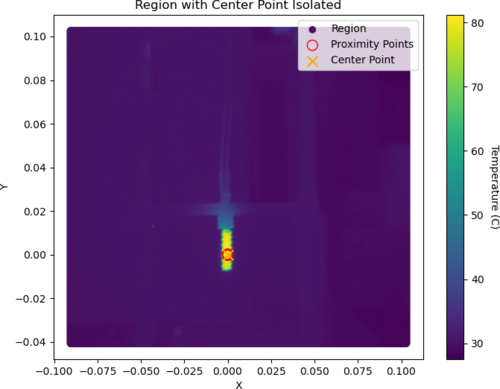
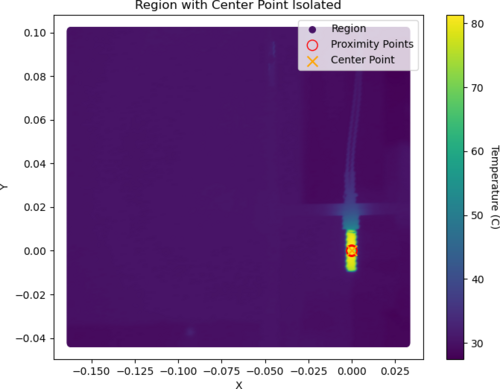
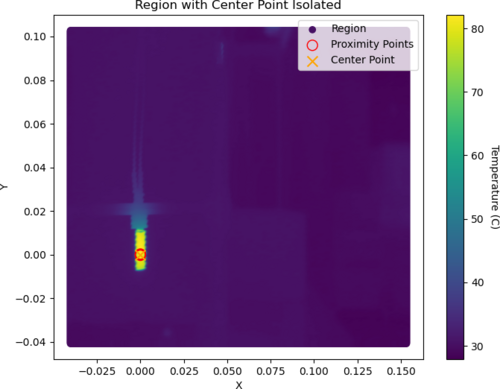
- Today I was able to plot a graph for the isolation point on the center of the heater. I got data from six different positions on the screen (I shifted the all coordinates). I extracted the data for the center point and plot the Gaussian with this extracted data for temperature. I attached the all plots below
- Also I took a snap using the black wall and with the heater at 120.1 C (0.30 A) try to have less noise but
we can see this is not very good. At this temperature, we have noise on the top and I don't understand why because the heater is not in this location. I attached a snap below.
|
| Attachment 1: 1_Isolated_Plot.png
|
|
| Attachment 2: 2_Isolated_Plot.png
|
|
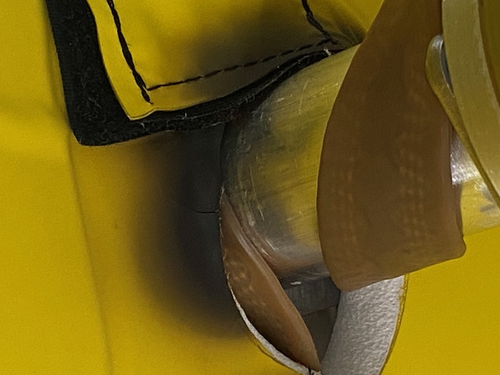
| Attachment 3: 3_Isolated_Plot.png
|
|
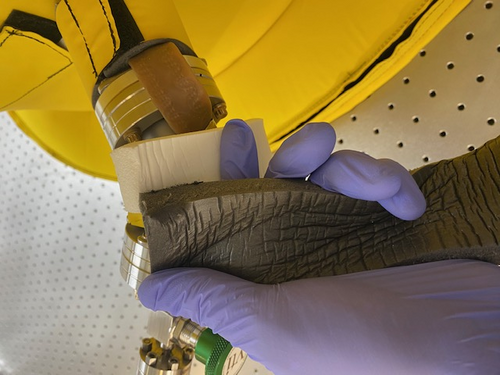
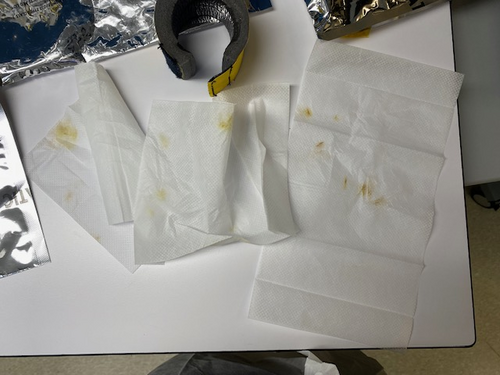
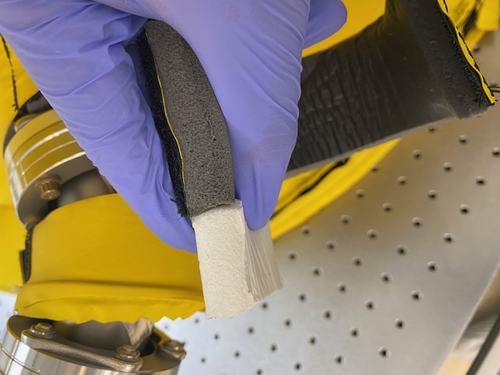
| Attachment 4: 4_Isolated_Plot.png
|
|
| Attachment 5: 5_Isolated_Plot.png
|
|
| Attachment 6: 6_Isolated_Plot.png
|
|
| Attachment 7: Gauss.plot-2.jpeg
|
|
| Attachment 8: AcquisitionImage(Jul-19-2023_17_01).jpg
|
.jpg.png)
|
|
168
|
Thu Jul 20 18:03:19 2023 |
Aiden | Update | VAC | Vacuum Chamber Baking Update |
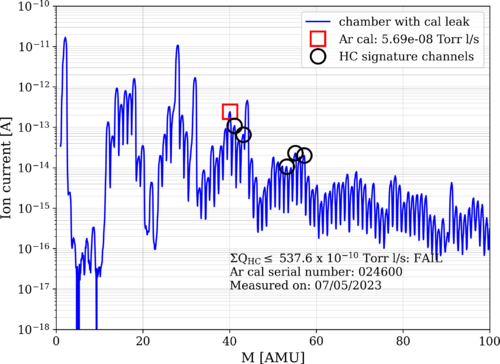
Took another set of RGA data after the second bake has cooled down to 27 degC.
Just by visual comparison to the other graphs, the HC levels of the chamber has gone down further. I will soon overlay the data for an easier comparison.
I also reinstalled the full range gauge above the RGA line. It is still adjusting itself downwards so I will have to check again to get an accurate measurement of the pressure.
|
| Attachment 1: bake2_230720.png
|
|
|
169
|
Thu Jul 20 21:00:23 2023 |
Pamella | Update | FLIR | Data plot FLIR and updates about the black body |
[Pamella]
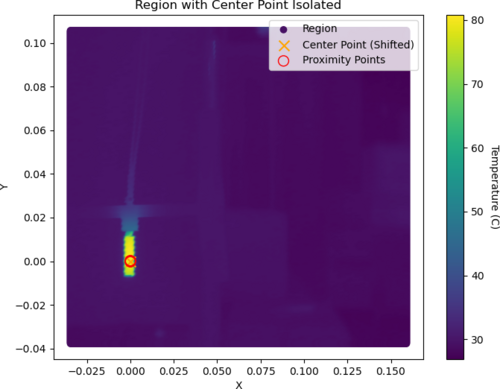
- Today I got more data to plot the Gaussian. So I took more snaps in each position for the six different spots than we be using to have a better calibration of the FLIR collected data. I attached the new plot below. Also, I did the same plot for each region as on the Elog 167 but I have more than 20 pics because I was using a big number of data so I just attached one example below.
To access the Elog, click here.
- Also I think we have some real (non-ideal) heat diffusion by the screen and not noise like Dr. Richardson suggested. I was testing today and we can see the first pic before the start heater source turns on, the second pic is at 120.2 C (0.31A) with the heater on and the last pic is after the heater source cooled back down to room temperature. Just in the second pic, we have a strong spot on the top, so it looks like a non-ideal diffusion.
|
| Attachment 1: AcquisitionImage(Jul-20-2023_13_09).jpg
|
.jpg.png)
|
| Attachment 2: AcquisitionImage(Jul-20-2023_13_15).jpg
|
.jpg.png)
|
| Attachment 3: AcquisitionImage(Jul-20-2023_13_33).jpg
|
.jpg.png)
|
| Attachment 4: AcquisitionData-480(Jul-20-2023_SIsolated_Plot.png
|
|
| Attachment 5: Gauss.plot-2.jpeg
|

|
|
170
|
Mon Jul 24 14:55:53 2023 |
Jon | Update | VAC | Removed extension power cable |
| I removed the extension cable that was powering the leftmost heater controller, since there is no bake currently happening. It is currently powering the LED over the electronics bench, and can be removed if needed. I will be ordering more extension cords to permanentize our setups. |
|
171
|
Mon Jul 24 16:19:29 2023 |
Shane, Jon | Update | Electronics | Chassis semi-assembled and moved |
| Began assembly on AA and AI chassis today, moved them both to top work bench shelf (image attached). They are delicate so please do not disturb them or put anything on top of them. |
| Attachment 1: IMG_8386.pdf
|

|
|
172
|
Tue Jul 25 15:35:14 2023 |
Shane | Update | Electronics | More chassis moved |
| Finished basic assembly of binary input and output chassis today, and moved one to top shelf of work bench. The other is in corner of work bench (image attached). They are delicate, so please do not move them or place anything on top of them. |
| Attachment 1: IMG_8409.HEIC
|
|
173
|
Thu Jul 27 10:18:43 2023 |
Celeste | Update | TCS | Graphical Updates to HOM RH Modification |
| Attached are updated graphs of the irradiance distribution from the 1/8th ring heater units (extruded and reduced in length). |
| Attachment 1: HOM_RH_1_8_Unit_Modification_Graphs.pdf
|

|
|
174
|
Thu Jul 27 11:28:36 2023 |
Sophia | Update | Scripts/Programs | Update on Laser Noise Data Collection and Analysis: Dynamic CSD and PSD Plots |
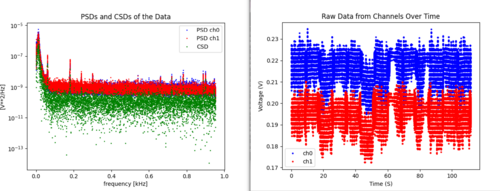
| This week I have successfully been able to implement our dynamic CSD and PSD plotting code, but along the way I encountered a few challenges which I will outline in this elog post.
Challenges:
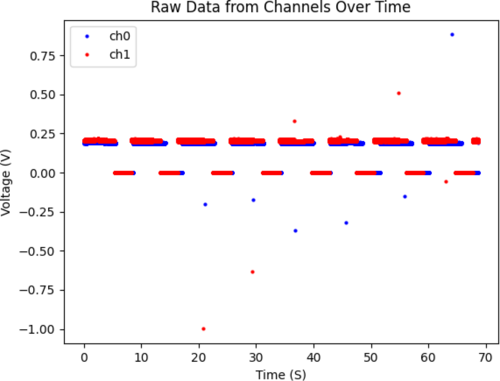
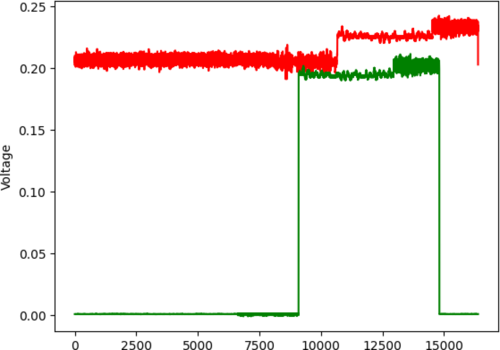
1. Once I was able to plot the data through time, I produced a graph of the raw data (shown below in the top to images) which showed pulsed data instead of a continuous stream. On Tuesday (26th of July) Tyler and I fixed this issue, realizing that calling the starting the trigger in the red pitaya was the issue. When I commented that line of code out, it immediately started plotting continuously.
2. When that issue was solved, We then started having problems with the automatically generated lines in the python program which would double back on each new iteration. I am still dealing with this issue, because the line likes to follow the progression of the data intake instead of through the plot. Currently, I am trying to plot the data as a scatter plot and then add the line as this might make it care only about the data's distribution instead of the order of the points in the list, but I am still unsure. I might try out np.sort (or some equivalent to sort the entire data set before plotting) as well. |
| Attachment 1: Screenshot_2023-07-26_at_3.02.05_PM.png
|
|
| Attachment 2: Screenshot_2023-07-26_at_1.38.47_PM.png
|
|
| Attachment 3: Screenshot_2023-07-27_at_1.36.24_PM.png
|
|
| Attachment 4: Screenshot_2023-07-27_at_1.33.01_PM.png
|
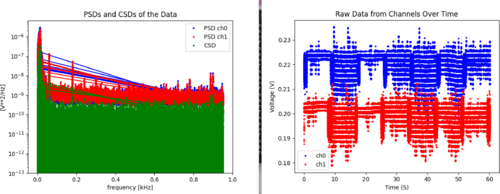
|
|
175
|
Thu Jul 27 14:11:42 2023 |
Sophia | Update | Scripts/Programs | Update on Laser Noise Data Collection and Analysis: Dynamic CSD and PSD Plots |
| Here's a screen recording of the dynamic raw data and PSD/CSD plots as they are now. Will begin working on implementing a code to generate the statistical estimator for the CSD uncertainty now. (Will talk to Tyler more about whether I can get the lines to happen or not) |
| Attachment 1: Screen_Recording_2023-07-27_at_5.08.25_PM.mov
|
|
176
|
Thu Jul 27 14:46:55 2023 |
Shane, Jon | Update | Electronics | AA chassis DC on/off switch assembled |
| Made the first DC on/off switch assembly today and installed in anti-aliasing chassis. Second switch assembly to be completed later. |
|
177
|
Fri Jul 28 13:07:39 2023 |
Shane, Aiden | Update | Cleanroom | cleanroom cleaning and particle count |
|
[Aiden, Shane]
cleaning cleanroom and particle count
- 11:08 am: started particle count
- zone 3:
- 0.3 u: 4198
- 0.5 u: 1080
- 1.0 u: 581
- zone 4:
- 0.3 u: 1247
- 0.5 u: 623
- 1.0 u: 415
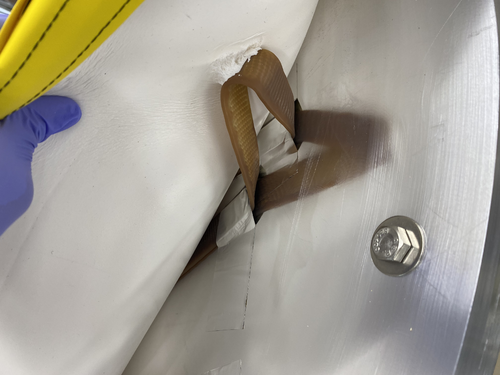
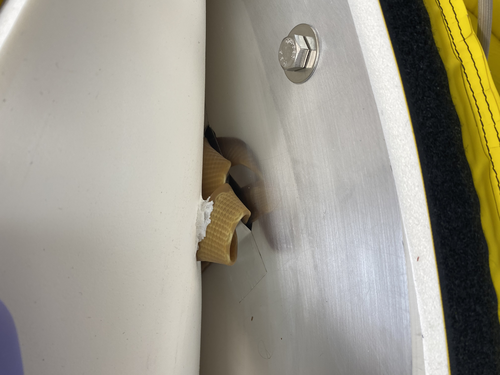
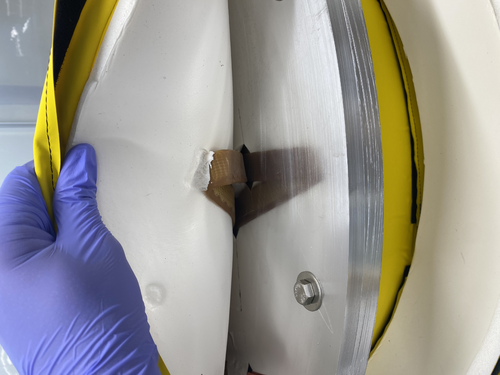
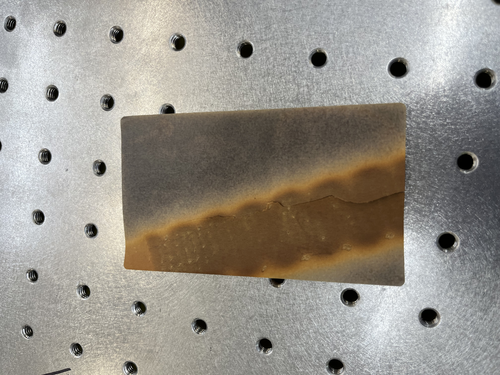
- 11:24 am: break for removal of vac chamber insulation (pictures attached), with counts before removal as seen above, and counts after removal/replacement for zone 3 as follows:
- zone 3:
- 0.3 u: 2993
- 0.5 u: 415
- 1.0 u: 207
- 12:02 pm: began surface check and wipedown
- 12:13 pm: started vacuuming the floor
- 12:25 pm: finished vacuuming the floor
- 12:26 pm: started mopping the floor
- 12:32 pm: finished mopping the floor
- 12:32 pm: started cleaning the buckets
- 12:37 pm: started mopping with IPA wipes
- 12:43 pm: finished mopping with IPA wipes
- 12:45 pm: changed sticky floor mats
- 12:47 pm: started particle count
- zone 3:
- 0.3 u: 2951
- 0.5 u: 290
- 1.0 u: 41
- zone 4:
- 0.3 u: 290
- 0.5 u: 0
- 1.0 u: 0
|
| Attachment 1: image_50412289.JPG
|
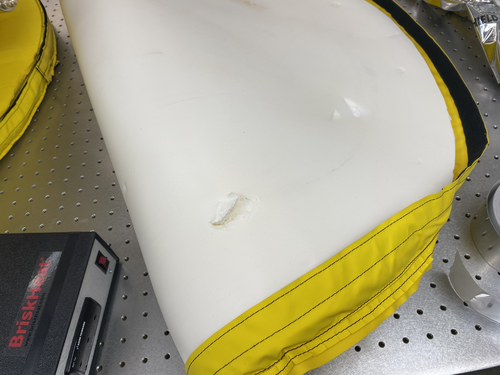
|
| Attachment 2: image_50432769.JPG
|
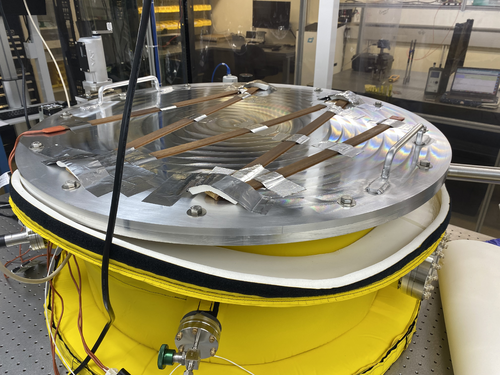
|
| Attachment 3: image_67126017.JPG
|
|
| Attachment 4: image_67163137.JPG
|
|
| Attachment 5: image_67168001.JPG
|
|
| Attachment 6: IMG_8427.jpeg
|
|
|
178
|
Fri Jul 28 13:39:39 2023 |
shane | Update | Cleanroom | full 5 zone cleanroom particle count |
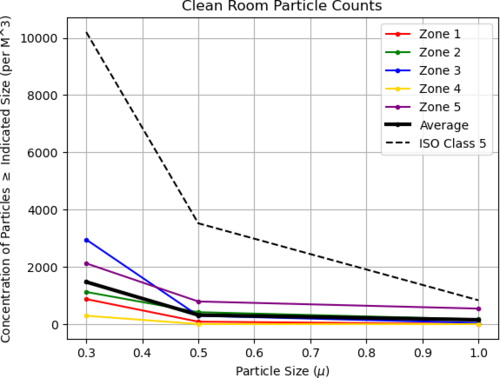
| Here's the 5 zone cleanroom measurement from today. |
| Attachment 1: download.png
|
|
|
179
|
Fri Jul 28 13:46:17 2023 |
Aiden | Update | VAC | Vacuum Chamber Baking Update |
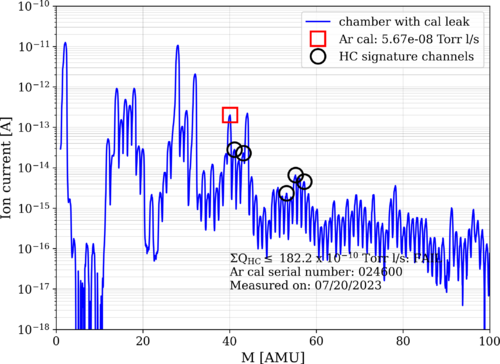
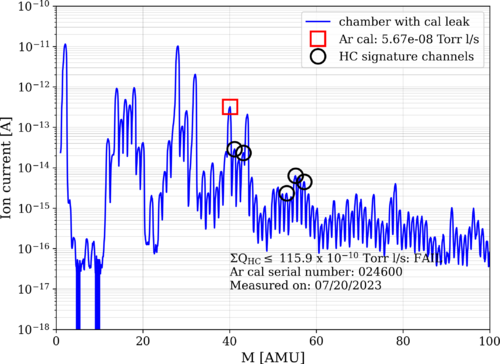
Took some more data to look at the HC count. Initial data was from leaving the Argon leak closed and then left it open for 15 minutes and then took data for the open scenario. Attached are the graphs for these where attachment 1 is the closed scenario and attachment 2 is the open scenario.
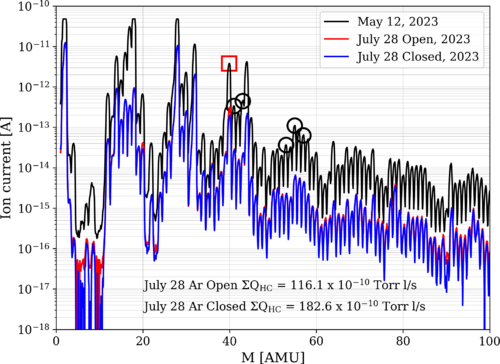
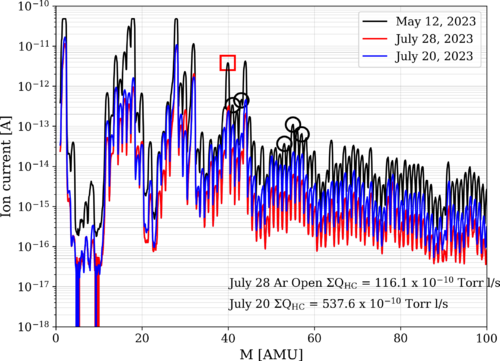
From these graphs it looks like the signal-noise ratio of our calibration line is poor with the ratio between these two being 1.3. This means that the calibrated leak is barely being detected over the background. This should improve with more baking and pumping. I have also now attached overlayed graphs comparing the chamber when the leak is closed versus when it is open. As well as one comparing the chamber right after the bake versus the most recent data both with the leak open.
|
| Attachment 1: bake2_230720_ArC.png
|
|
| Attachment 2: bake2_230720_ArO.png
|
|
| Attachment 3: bake2_230728_Closed_Open.png
|
|
| Attachment 4: bake2_230728_Open_Open.png
|
|
|
180
|
Fri Jul 28 17:45:45 2023 |
Celeste | Update | TCS | Graphical Updates to HOM RH Modification, Friday 7/28 |
| Updated 1/8th Heater simulation modification graphs. Slides 7, 10, 16-19 are new additions. |
| Attachment 1: HOM_RH_Simulation_Progress.pdf
|

|
|
181
|
Fri Jul 28 18:03:07 2023 |
Pamella | Update | FLIR | Final plot - FLIR |
[Pamella]
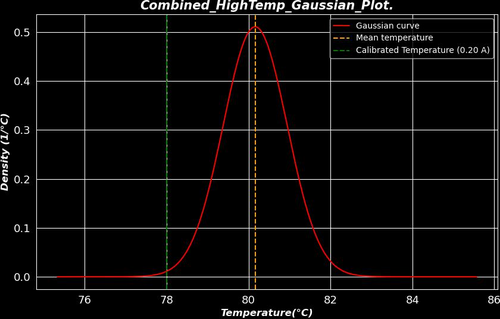
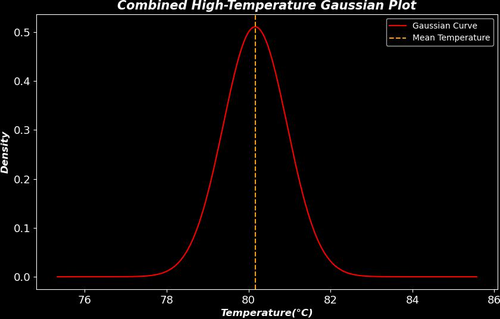
- I was able to plot the final result with the data to the heater. I attached below the "3Combined_HighTemp_Gaussian_Plot." in this plot we can see better behavior on the Gaussian compared to the plot in ELOG 169, I was using the same data but with a different approach. On the ELOG 169, we have the center point isolated data and this new plot is the temperature more than 70 C isolated because we have a very good heater temperature distinguish do background. For the all data I got I was using a power current of 0.20A. To get the data I waited for 30 minutes until the heater became stable and after that, I started to take snaps, I took more than one snap for each one different 6 positions on the screen, and We can see the positions on ELOG 167.
- Also I attached the calibration plot ("calibration_plot") between the measurements with the FLIR camera and thermocouple and we can see looks good if we compare the final plot.
- For better analyses I attached a plot of the calibration line on the Gaussian plot.
- To do: I will finish the final report.
|
| Attachment 1: 29Combined_HighTemp_Gaussian_Plot.jpg
|
|
| Attachment 2: 3Combined_HighTemp_Gaussian_Plot.jpg
|
|
| Attachment 3: calibration_plot(2).png
|
.png.png)
|
|
182
|
Mon Jul 31 12:39:01 2023 |
Shane | Update | Electronics | LED cable assemblies installed |
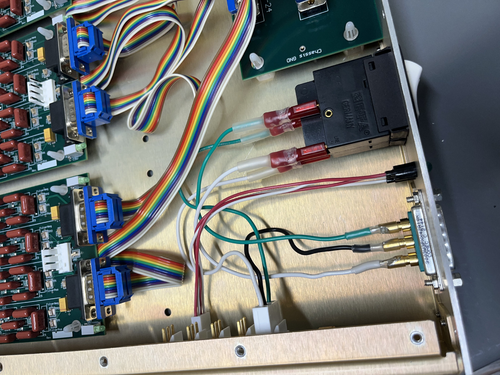
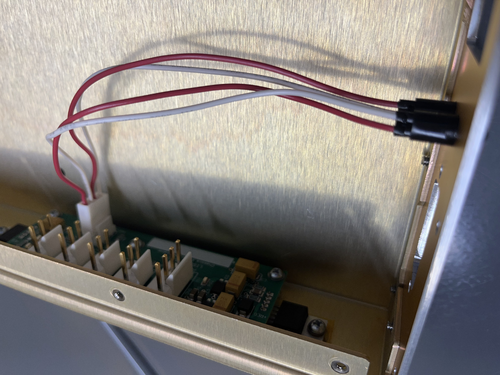
| Today I put together the two LED cable assemblies for the CyMAC and mounted them in the anti-aliasing and anti-imaging chassis. |
| Attachment 1: IMG_8514.jpeg
|
|
| Attachment 2: IMG_8516.jpeg
|
|
|
183
|
Mon Jul 31 19:27:30 2023 |
Sophia | Update | Scripts/Programs | Update on Laser Noise Data Collection and Analysis: Dynamic CSD and PSD Plots |
| An update on the CSD/PSD code:
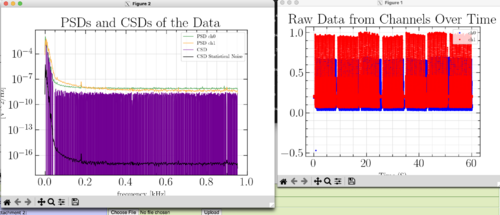
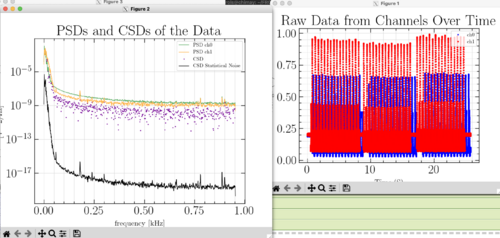
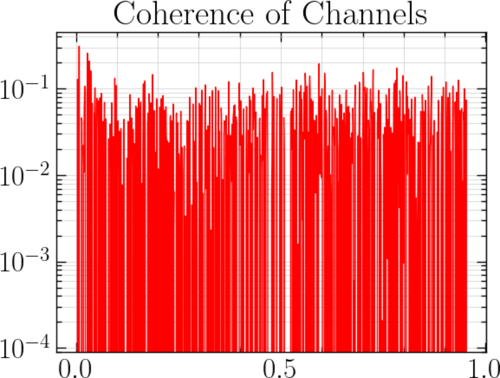
The code is now taking a dynamic average of the points, and that has significantly reduced the noise that we were reading and the issues I was having with the lines in the plots. The graph for the CSD is still putting up a fight though, and amassing many lines that do not appear when just scatter plotted. I plan to fix that tomorrow, alongside inserting my own generated signal into the data. I have plotted the coherence alongside these graphs (as shown in the first screen recording and in one of the images), and it is significantly less than 1-- starting at or below 10^(-1).
As a note, I am unsure of why the raw data looks like this-- the laser goes through periods of extreme noise and I think this data was taken during one of them. |
| Attachment 1: Screenshot_2023-07-31_at_10.18.44_PM.png
|
|
| Attachment 2: Screen_Recording_2023-07-31_at_10.16.31_PM.mov
|
| Attachment 3: Screen_Recording_2023-07-31_at_10.19.55_PM.mov
|
| Attachment 4: Screenshot_2023-07-31_at_10.21.44_PM.png
|
|
| Attachment 5: Screenshot_2023-07-31_at_10.26.34_PM.png
|
|
|
184
|
Tue Aug 1 12:10:03 2023 |
Aiden | Update | VAC | Vacuum Chamber Baking Update |
Dr. Richardson and I took off the insulation on the lid again to add more insulation in-between the heater tape folds in addition to what was added on top of the tape after discovering discoloration. Also cleaned the lid with IPA wipes.
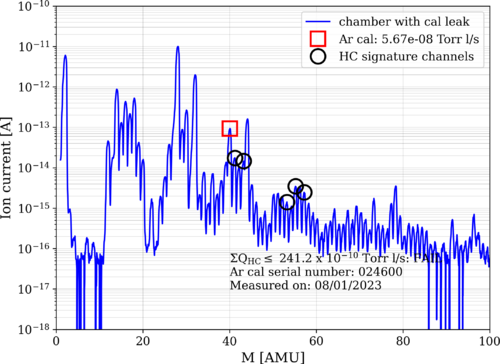
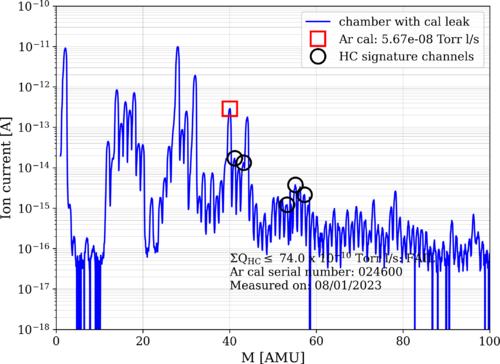
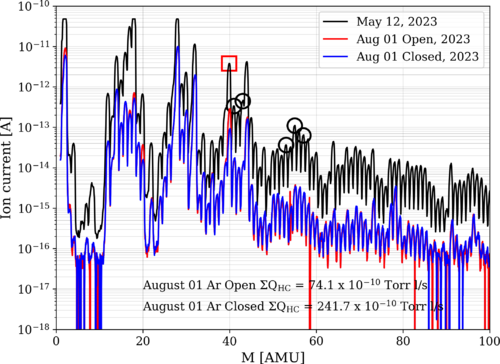
Also took more RGA data, one with the leak closed and one with the leak open. The graphs below this show that the SNR is improving with the ratio now looking to be around 3. The chamber is still too dirty to be commissioned and we will need to be baked again soon.
Plugged the temperature sensor back in after getting another extension cord. Removed the electronics box for the RGA as well as the full range gauge above the RGA line.
|
| Attachment 1: bake2_230801_ArC.png
|
|
| Attachment 2: bake2_230801_ArO.png
|
|
| Attachment 3: bake2_230801_Closed_Open.png
|
|
|
185
|
Tue Aug 1 12:48:41 2023 |
Aiden | Update | Cleanroom | Pre Filter Change |
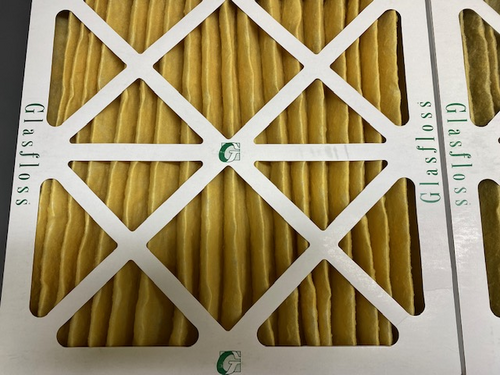
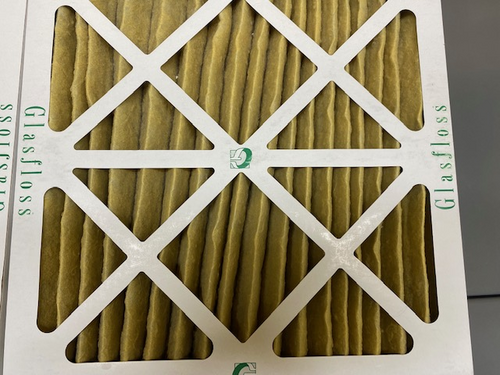
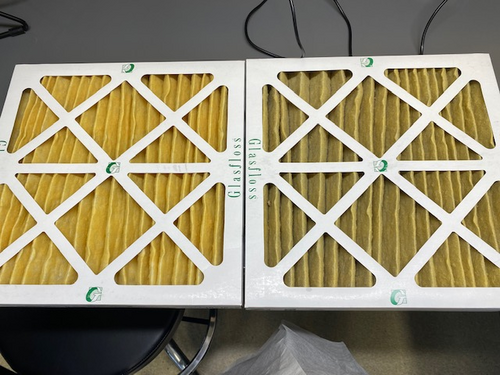
Changed the pre filter inside of the 3 stage HEPA system next to the soldering station. It was rather dirty and I have attached images with a clean filter on the left and the used one on the right. I reset the pre filter age on the system. I tried to see if I could tell if the HEPA filter was dirty but I could not see it. I did not reset the age of the HEPA or UV stations. They are currently 378 days old.
|
| Attachment 1: IMG_4564.jpg
|
|
| Attachment 2: IMG_4563.jpg
|
|
| Attachment 3: IMG_4562.jpg
|
|
|
186
|
Tue Aug 1 15:44:31 2023 |
Sophia | Update | Scripts/Programs | Update on Laser Noise Data Collection and Analysis: Dynamic CSD and PSD Plots |
| We have identified two problems facing the intensity noise calculations, which we are working to solve.
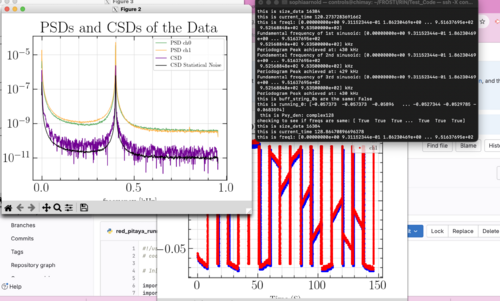
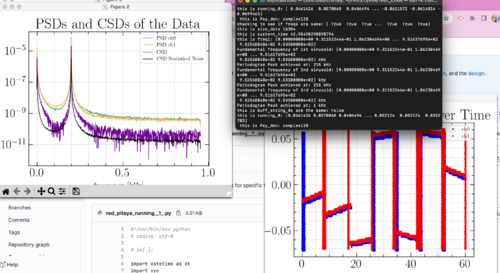
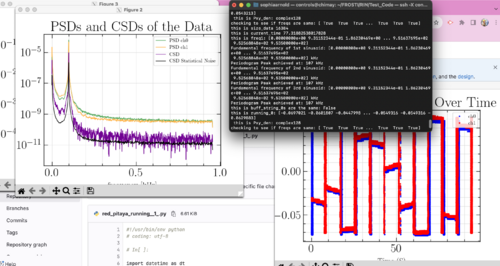
The first of these problems, is that the red pitaya appears to be taking data approximately 4 times faster than we would expect from the decimation rate based on how quickly it runs. To see if this was affecting our data, we plugged the red pitaya into a function generator. We found that my code is able to identify the driving frequency, but consistently gives predictions that are roughly 7% greater than we expect. When we drive at 100 Hz, the plot says the peak is at 107 Hz, when driven at 400 Hz, we see between 422-427 Hz, etc. While this implies that the red pitaya is not taking data at a faster rate than we would expect (if it did we would anticipate a lower than expected frequency, by a factor of roughly 4), it does imply some intrinsic issue with either the red pitaya or with the code. To fix this, I am going to use my code on artificially generated signals and see if we still observe these issues. |
| Attachment 1: Screen_Recording_2023-08-01_at_5.28.39_PM.mov
|
| Attachment 2: Screen_Recording_2023-08-01_at_5.29.46_PM.mov
|
| Attachment 3: Screen_Recording_2023-08-01_at_5.31.00_PM.mov
|
| Attachment 4: Screenshot_2023-08-01_at_5.42.53_PM.png
|
|
| Attachment 5: Screenshot_2023-08-01_at_5.44.34_PM.png
|
|
| Attachment 6: Screenshot_2023-08-01_at_5.45.35_PM.png
|
|
|
187
|
Tue Aug 1 16:22:35 2023 |
Celeste | Update | TCS | Graphical Updates to HOM RH Modification, Tuesday 8/1 |
| Slides 20-33 are newly added (data/graphs from parameter sweep feature-1/8th heater unit length varied from 10% of original to 100% of original). |
| Attachment 1: HOM_RH_Simulation_Progress_80123.pdf
|

|
|
188
|
Wed Aug 2 17:02:38 2023 |
Aiden | Update | VAC | VAC System Heating Update |
Moved the temperature sensor on the PID controller to one of the switch backs on the lid.
Also started the next bake with both PID controllers set to 150 degC. When leaving the temperature sensors above the chamber read 119 C and 83 C. These sensors are on the chamber wall and flange in front of the turbo pump respectively.
|
|
189
|
Thu Aug 3 16:00:25 2023 |
Aiden | Update | VAC | VAC System Heating Update |
| Check on the temperature of the bake today to see the equilibrium temperatures. With both of the PID controllers set to 150 C, the temperature sensors for the wall of the chamber and the flange in front of the turbo pump read: 125 C and 90 C respectively. At these temperatures the bake would need to last at least a week unless the temperature were to be increased. |
|
190
|
Thu Aug 3 17:47:51 2023 |
Aiden | Update | VAC | VAC Heating System Update |
Did some further testing to determine if it was within reason to increase the temperature of the chamber. I used a thermometer and pulled back some insulation to test many points on the chamber. Mainly focused on the barrel and the bottom lid of the chamber to see if it was possible to increase the temperature of just the PID controller that is powering the bottom half of the chamber.
Found that the barrel of the chamber seems to be hotter than what the sensor is saying, 125 C. Found many points on the barrel that reached 140 C. I believe this is because the sensor is taped on top of the heater tape rather than in between the aluminum and the heater tape.
Also measured many points on the bottom lid as it has the same configuration the top did before it damaged the insulation. It seemed to be consistently at 150 C but I was able to find a couple points that were hotter around 160 C. These hotter spots were most likely the heater folds. There is not much we can do about this as removing the insulation for fixing would required a very invasive procedure to do it safely.
Then moved to the stainless steel tube that connects the RGA and Turbo pump lines. This tube was around 150 C but many points on it were hotter around 160 C. Before another bake I think some of the tape around the tube may need to be pulled back and relocated to avoid damaging insulation while also providing more heat to the main body of the chamber.
Measured a couple more points on the cross that connects the RGA and the full range gauge and found it to be around 130-140 C which means this section could be hotter as the electronics of the full range gauge can reach 150 C.
Over all I believe that the chamber temperature should not be increased in its current state as the bottom lid is a concern with what happened with the top in the second bake. Some optimizations could be made for a fourth bake however. Moving the temperature sensors to be between the heater tape and chamber. Pulling some of the heater tape from the stainless steel tube and relocating it to the main body of the chamber. Moving the PID temperature sensor on the tube to be on the bottom lid or another hotter spot. These are some changes I would make for a fourth bake but maybe this bake could be the last with how the second bake went.
|
|
191
|
Thu Aug 3 18:03:42 2023 |
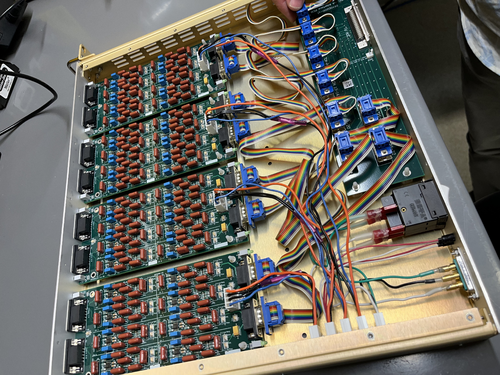
Shane, Jon | Update | CDS | Anti-Aliasing chassis complete |
| We finished installing the internal power supply cables in the anti-aliasing chassis today, which concludes its assembly. Work on AI, BI, BO chassis still underway. |
| Attachment 1: IMG_8544.jpeg
|
|
|
192
|
Fri Aug 4 15:21:33 2023 |
Aiden | Update | VAC | VAC System Heating Update |
| Checked on Bake 3 today and the temperature sensors read 126 C and 91 C for the chamber barrel and turbo pump flange respectively. These were reached while the PID controllers were set to 150 C. |
|
193
|
Mon Aug 7 13:58:46 2023 |
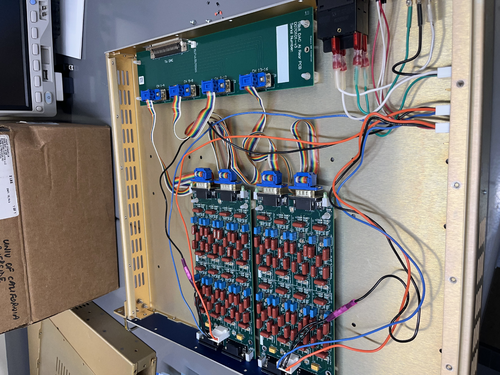
shane | Update | CDS | internal power supply cables done for AI chassis |
| Finished assembling and installing the aLigo chassis internal power supply cables in the anti-imaging chassis today. Tested for continuity and everything looked good. Chassis lid still secured with two temporary screws because I'm not sure what the correct size is. |
| Attachment 1: IMG_8674.jpeg
|
|
|
194
|
Mon Aug 7 15:36:18 2023 |
Sophia | Update | Scripts/Programs | Update on Laser Noise Data Collection and Analysis: Dynamic CSD and PSD Plots |
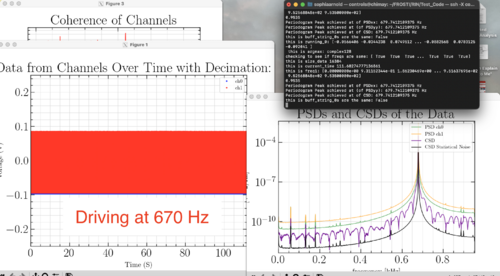
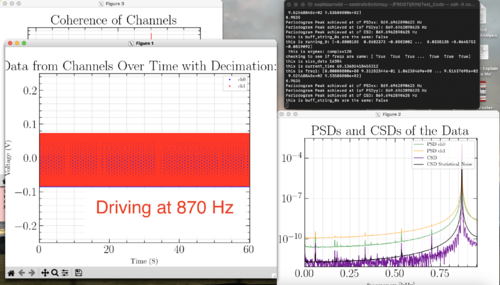
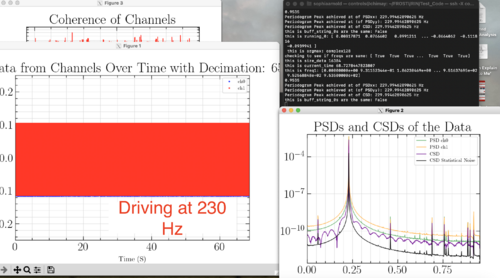
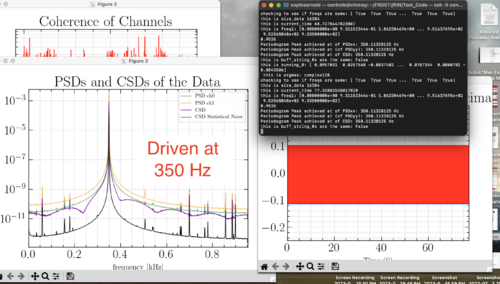
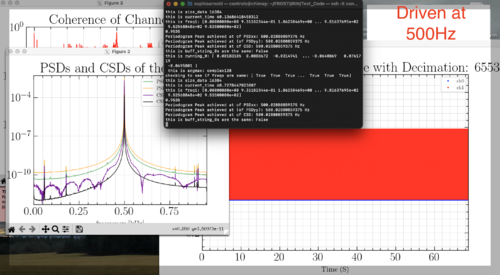
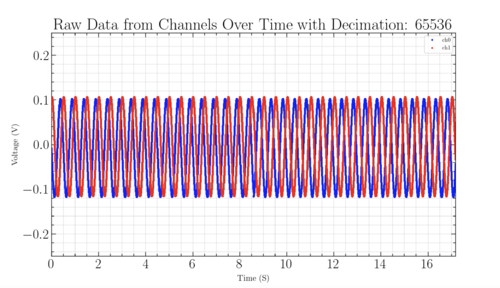
| Today I was able to fix the red pitaya's plotting problem, and get my code to recognize driving frequencies from the function generator to within a 0.5 Hz estimation. The sinusoidal plots I have included are from sending a 1 Hz signal into the red pitaya to see the signal in real time. This allowed me to see exactly where the system was messing up, and fix from the ground up. Once I had that working, I began to test sending in frequencies in the range that my PSD/CSD code could observe and I was able to identify each driving frequency within 0.5 Hz. My code was able to correctly identify a 500 Hz signal, while other analyzed frequencies in the observable range have fallen lower than the sent in frequency by a less than 0.5 Hz. I believe this issue comes from the strange speed that the red pitaya is still acquiring data, even with my fixing it to now observe a continuous signal. |
| Attachment 1: Screenshot_2023-08-07_at_6.19.44_PM.png
|
|
| Attachment 2: Screenshot_2023-08-07_at_6.16.40_PM.png
|
|
| Attachment 3: Screenshot_2023-08-07_at_6.13.47_PM.png
|
|
| Attachment 4: Screenshot_2023-08-07_at_6.06.22_PM.png
|
|
| Attachment 5: Screenshot_2023-08-07_at_6.04.28_PM.png
|
|
| Attachment 6: Screen_Recording_2023-08-07_at_5.01.54_PM.mov
|
| Attachment 7: Screenshot_2023-08-07_at_6.26.09_PM.png
|
|
|
195
|
Tue Aug 8 15:31:26 2023 |
Aiden | Update | VAC | VAC Heating System Update |
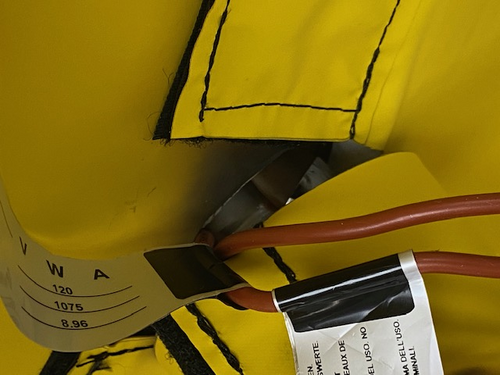
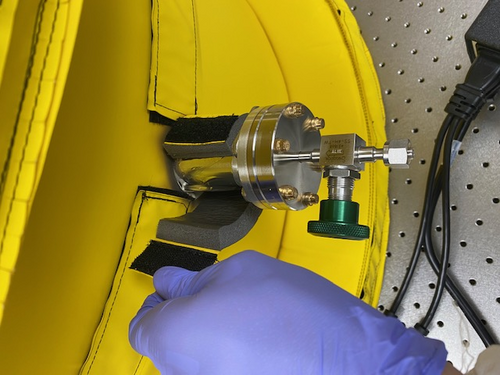
Vacuum Chamber equilibrium temperature for bake 3 are 126 C and 88 C for the chamber wall and turbo pump flange respectively. There were reached with the PID controllers both being set to 150 C.
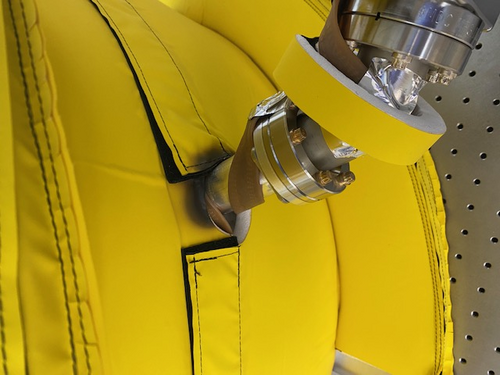
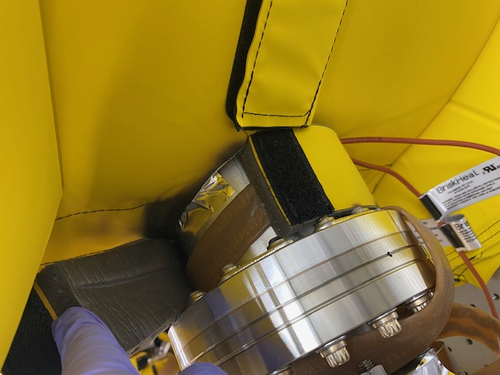
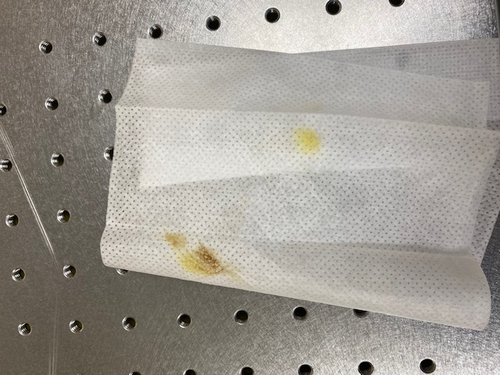
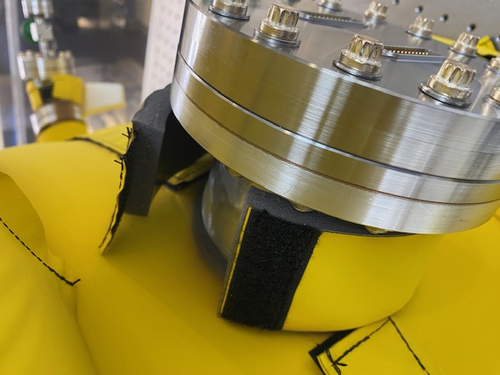
Also noticed some discoloration around the port insulation. It could be burned from being exposed to the heater tape directly without insulation or it could be that the insulation, which looks much different, is depositing something around the ports.
The turbo pump overheated and the heating tape had to be turned off in order to get the pump back online. It was unusually hot at 52 C. Hottest it got in bake 2 was 38 C.
|
| Attachment 1: IMG_4583.jpg
|
|
| Attachment 2: IMG_4581.jpg
|
|
| Attachment 3: IMG_4584.jpg
|
|
| Attachment 4: IMG_4582.jpg
|
|
| Attachment 5: IMG_4579.jpg
|
|
| Attachment 6: IMG_4578.jpg
|
|
| Attachment 7: IMG_4577.jpg
|
|
| Attachment 8: IMG_4576.jpg
|
|
| Attachment 9: IMG_4572.jpg
|
|
| Attachment 10: IMG_4575.jpg
|
|
|
196
|
Tue Aug 8 16:47:11 2023 |
Sophia | Update | Scripts/Programs | Update on Dynamic CSD and PSD Plots |
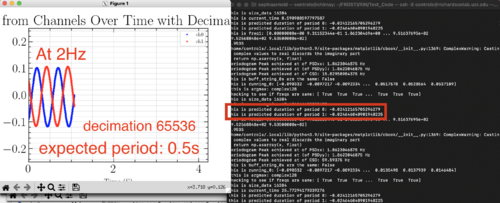
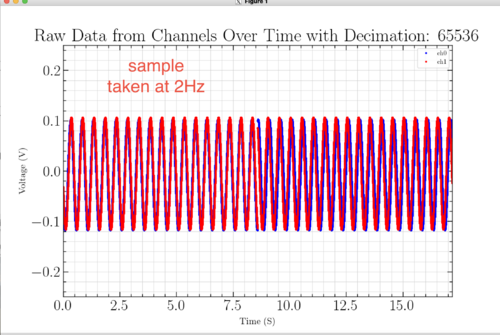
| We have fixed our rapid plotting error, and realized that this has not been affecting our data intake! Below is a video of the code progressing, alongside grabbed images of the raw data. The data is now continuous, and performs as we expect. Next, I plan to add a widget which will dynamically show the peak values instead of them just being printed in the terminal after each iteration. (Ignore the red box-- it was from me struggling with a now fixed issue). |
| Attachment 1: Screen_Recording_2023-08-08_at_7.42.30_PM.mov
|
| Attachment 2: Screenshot_2023-08-08_at_2.22.50_PM.png
|
|
| Attachment 3: Screenshot_2023-08-08_at_5.16.08_PM.png
|
|
|
197
|
Tue Aug 8 17:03:22 2023 |
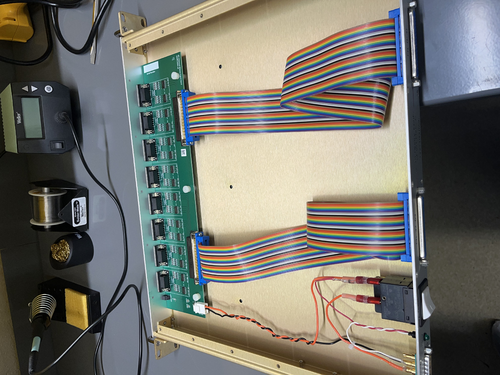
Shane, Jon | Update | CDS | Binary input chassis finished |
| Finished assembly of the binary input chassis today, including DC on/off switch and LED installation. external cable assemblies still needed, but internal work done. |
| Attachment 1: IMG_8681.jpeg
|
|
|
199
|
Wed Aug 9 17:35:26 2023 |
Shane | Update | CDS | Binary output chassis finished |
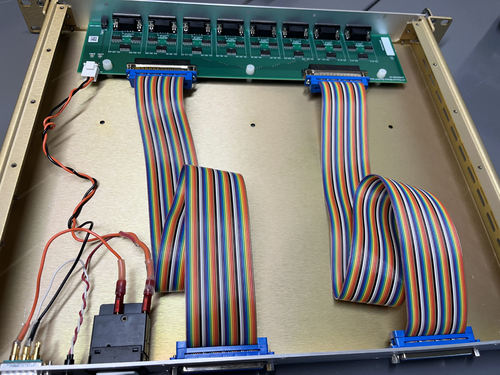
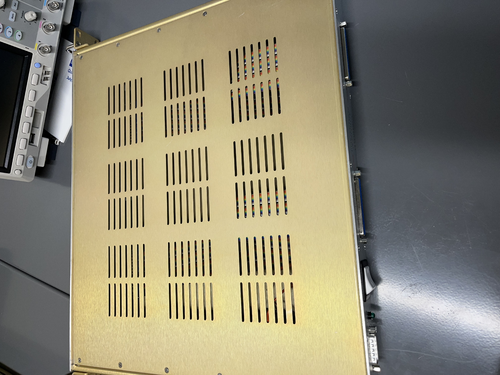
| Finished the internal wiring for the binary output chassis today, which completes its assembly. Also secured ribbon cables and chassis lid with their respective screws. Note: one of the spade lugs' internal metal piece is a little loose and had to be reinserted after falling out once. Seemed secure after this, and I checked continuity on everything and it was all good. |
| Attachment 1: IMG_8685.jpeg
|
|
| Attachment 2: IMG_8686.jpeg
|
|
|
200
|
Thu Aug 10 14:13:38 2023 |
Celeste | Update | TCS | 8/10/23, Simulation Graphical Progress |
|
| Attachment 1: Simulation_Progress__8_10_23.pdf
|

|
|
201
|
Thu Aug 10 14:36:00 2023 |
Aiden | Update | VAC | VAC System Heating Update |
| Came in to install one of the Full range gauges. Checked the temperature first of the cross and it was reading 30 C. After installing the gauge above the RGA line the controller was reading 2E-1 torr. Installed the other full range gauge to confirm this and it also read that pressure. There may be a leak so I will let it sit for a bit and then perform a Helium leak test. |
|
202
|
Thu Aug 10 15:10:12 2023 |
Jon | Update | VAC | VAC System Heating Update |
| I shut down the turbo pump since this is evidently a large leak. We CANNOT turn on the RGA for leak checking with the pressure above 1E-5 Torr.
I think we will have to manually inspect it. The most likely cause would be that the Viton seal around the lid overheated and failed.
| Quote: |
| Came in to install one of the Full range gauges. Checked the temperature first of the cross and it was reading 30 C. After installing the gauge above the RGA line the controller was reading 2E-1 torr. Installed the other full range gauge to confirm this and it also read that pressure. There may be a leak so I will let it sit for a bit and then perform a Helium leak test. |
|
|
203
|
Thu Aug 10 18:32:39 2023 |
Aiden | Update | VAC | VAC System Heating Update |
[Dr. Richardson, Aiden]
DO NOT TOUCH ANY VALVES ON THE CHAMBER. THERE IS A PRESSURE DIFFERENTIAL BETWEEN THE RGA LINE, TURBO PUMP LINE AND THE MAIN VOLUME. THE TURBO PUMP WILL BE DESTROYED IF OPENED.
Closed the valves to the turbo pump line and RGA line. Turned the turbo pump back on and saw that the pressure in the RGA Line and Turbo pump line was going down so there was no large leak within that line or with the valves as the main body pressure stayed constant. Then raised the pressure of the main body of the chamber as we suspect the viton o-ring has failed and needs to be changed. The bolts to the lid of the chamber were also removed but the lid was left on.
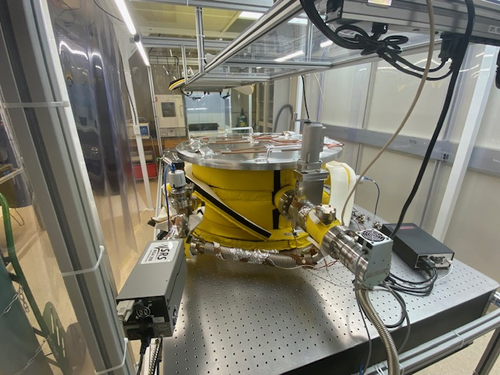
Then performed a helium leak test on the section of the system that was under vacuum. We found two flanges that had small but significant leaks compared to the others in the lines. The flange connecting the full range gauge to the cross and the flange connecting the stainless steel tube to the valve under the cross. These showed large spikes when sprayed with helium and were then tightened to hopefully fix it. After tightening, the flange under the full range gauge was fixed as the bolts were pretty loose and tightening reduced any spike seen on leak test. The other flange on the SS tube could not be fixed with tightening and it still shows signs of helium leaking through. This flange will need to have its gasket changed to fix this leak. Then left the system where it is in the picture for further changes tomorrow August 11. Again, DO NOT TOUCH THE VALVES ON THE RGA LINE AND TURBO PUMP LINE AS THERE IS A PRESSURE DIFFERENTIAL AND IT WILL DESTROY THE TURBO PUMP IF OPENED.
Note: We also found that the pump under the table had flipped the breaker and needed to be turned back on. This may be something to look into.
|
| Attachment 1: IMG_4588.jpg
|
|
|
204
|
Fri Aug 11 10:57:20 2023 |
Celeste | Update | TCS | 8/11/23 Simulation Progress |
|
| Attachment 1: Simulation_Progress__1_32nd_Model_(1).pdf
|
.png)
|
|
205
|
Fri Aug 11 18:32:00 2023 |
Aiden | Update | VAC | VAC System Heating Update |
[Dr. Richardson, Aiden] Large Update
Removed most of the insulation on the chamber in order to pull back some of the heater tape to get to the flange connecting the bypass line to the valve under the RGA line. Most of the heater tape on the bottom half of the chamber was pulled off and the rest will need to be removed as well in order to place the start of the heater tape on the barrel of the chamber rather than one of the flanges.
Engaged the valve under the RGA line to prevent it from getting more contaminated. Turned off the turbo pump. Turned off the scroll pump. Let the turbo pump sit for a few minutes to let the fans stop. Then leaked the turbo pump volume by turning the knob slowly on top of the turbo. Then proceeded to unscrew the bypass line after done leaking the volume. Replaced the copper gasket and then proceeded to screw it on while maintaining a circular path to ensure equal pressure on the gasket. BEWARE THAT REUSING SILVER PLATED SCREWS HAS A HIGH CHANCE OF STRIPPING THE SCREW AND WILL RESULT IN A LOT OF WORK TO GET THEM OFF. IT IS RECOMMENDED TO USE NEW SILVER SCREWS. HOWEVER WE HAVE NONE LEFT SO DO NOT TRY TO REUSE ANY SCREWS UNTIL WE HAVE SPARES. We were able to use the remaining two spare screws to tighten the flange to a point where it will not tighten anymore.
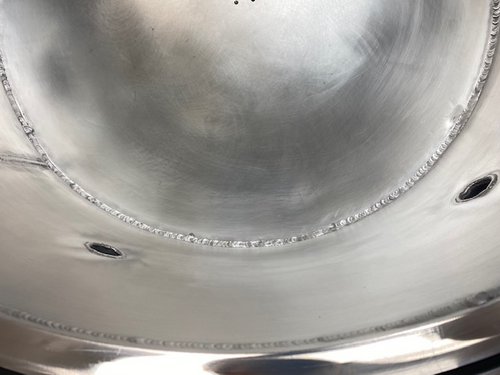
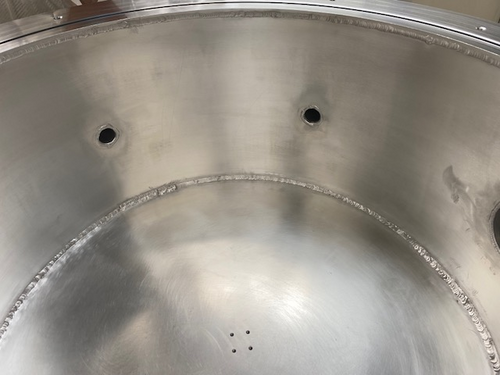
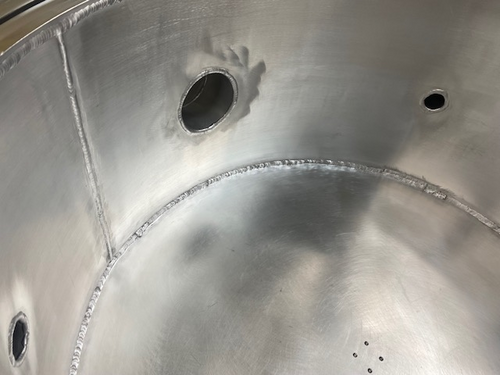
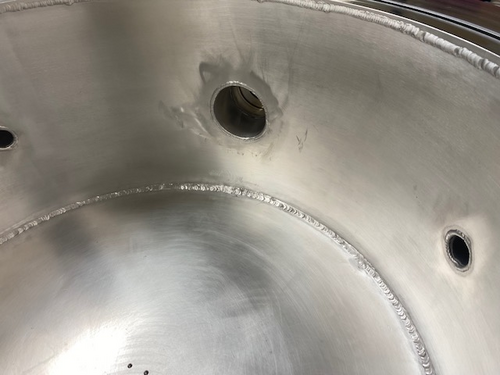
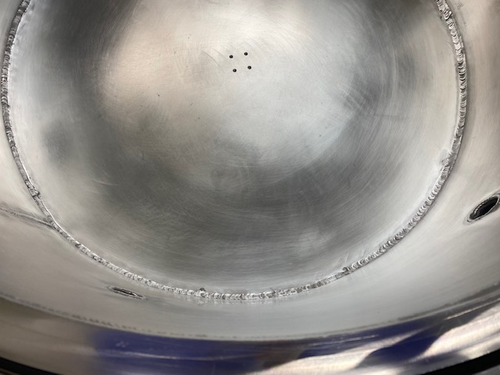
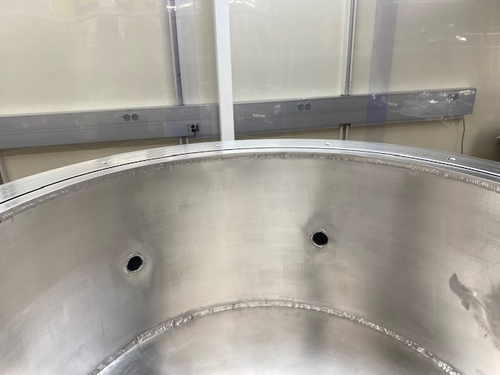
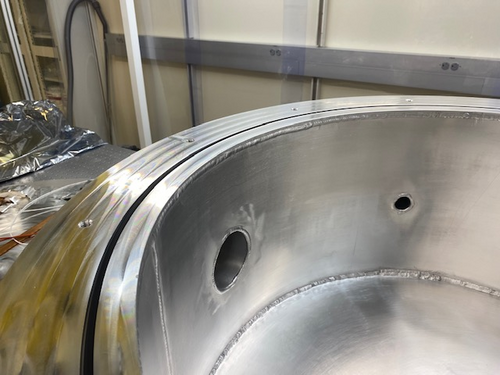
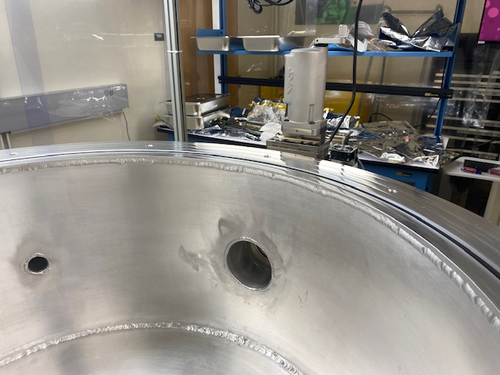
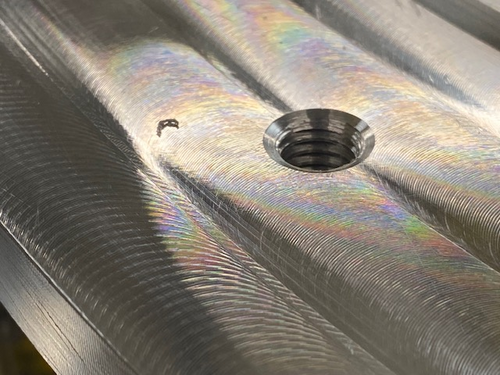
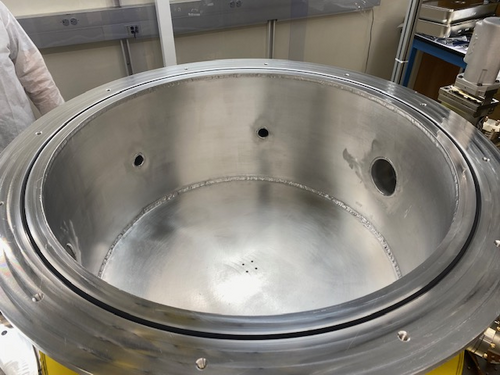
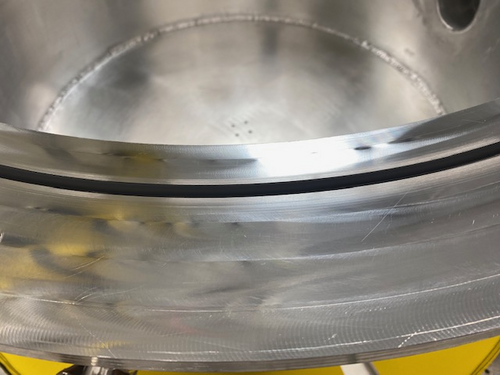
Then the lid was removed in order to inspect the inside of the chamber and the Viton O-Ring. The chamber had no physical damage and the viton had some visual damage that may correlate to the failure observed during bake 3. Note that some metal chips were found inside of the o-ring groove and needed to be removed. We changed out the o-ring for a new one and placed the old one inside of an anti static bag labeled "Viton O-Ring". Put the lid back on after inspecting for damage and put the bolts on hand tightened. Started to pump down again by turning on the scroll pump first until full range gauge 1 read below 1 torr and then began to turbo pump. The turbo pump was running for 1.5 hours until it plateaued around 3e-4 torr. We then realized the bolts on the lid needed to be tightened more with a wrench. After further tightening the pressure quickly dropped to 6e-6 torr. In the future the bolts should be tightened with a wrench from the begining.
Then proceeded to Helium leak test every weld, flange, and valve. Two of the flanges needed a little more tightening such as the 2 6" flanges. Other than that the only noticeable leak was from the flange just fixed today, however the leak is 10 times less than how it was yesterday and will most likely not hold the chamber back from reaching low 10e-8 torr pressures.
|
| Attachment 1: IMG_4592.jpg
|
|
| Attachment 2: IMG_4593.jpg
|
|
| Attachment 3: IMG_4594.jpg
|
|
| Attachment 4: IMG_4595.jpg
|
|
| Attachment 5: IMG_4596.jpg
|
|
| Attachment 6: IMG_4597.jpg
|
|
| Attachment 7: IMG_4598.jpg
|
|
| Attachment 8: IMG_4599.jpg
|
|
| Attachment 9: IMG_4601.jpg
|
|
| Attachment 10: IMG_4602.jpg
|
|
| Attachment 11: IMG_4603.jpg
|
|
|
206
|
Tue Aug 15 10:35:00 2023 |
Sophia | Update | Scripts/Programs | Update on Laser Noise Data Collection and Analysis: Dynamic CSD and PSD Plots |
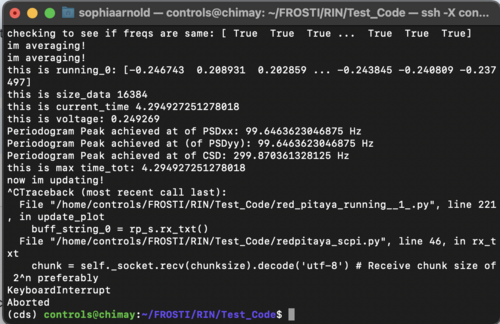
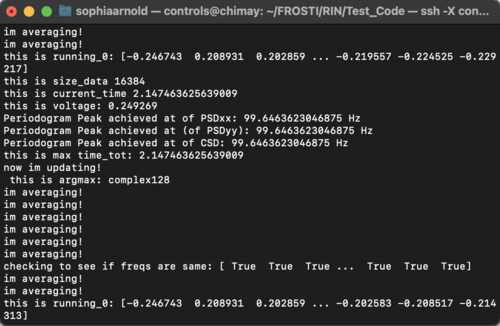
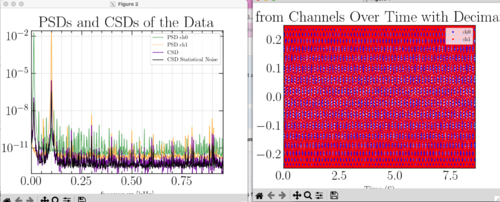
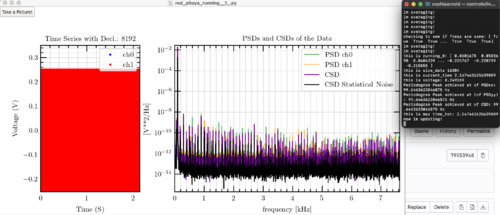
| I have successfully added a button to my graphics, but it has posed a strange issue with the CSD and PSD values. When I plot my original code, I still see the pretty peaks that I was getting originally, while my new code (as shown in the video and in the last screenshot) is giving me more of a line. In my code that gives the peak values, the CSD values also tend to fluctuate in this new code as well (shown in the first screenshot), before returning to the real value.
I think that there is a problem with the averaging and am hoping to solve this issue today with Tyler. This is good progress though! |
| Attachment 1: Screenshot_2023-08-14_at_8.18.49_PM.png
|
|
| Attachment 2: Screenshot_2023-08-14_at_8.18.43_PM.png
|
|
| Attachment 3: Screen_Recording_2023-08-14_at_8.17.50_PM.mov
|
| Attachment 4: Screenshot_2023-08-15_at_1.24.54_PM.png
|
|
| Attachment 5: Screenshot_2023-08-15_at_1.32.30_PM.png
|
|