|
ligo-ex
ligo-ds
|
| Richardson Lab Experimental Log |
Not logged in |
 |
|
|
|
|
|
Message ID: 164
Entry time: Tue Jul 18 16:12:27 2023
In reply to: 159
|
| Author: |
Pamella |
| Type: |
Update |
| Category: |
FLIR |
| Subject: |
Thermocouple plot. |
|
|
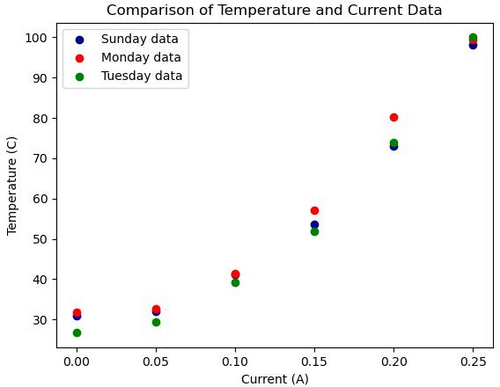
- I noticed that these measurements have some issues with the weather on different days. We can see in the photo attached below how different the temperatures are on different days, I took the data with the same procedure every day, but we can see the differences between them.
- To Do: I will do a new data collection using FLIR and thermocouple at the same time to plot comparison between both.
| Quote: |
[Pamella]
- I collected data to plot a calibration with the heater. I took measurements with current and temperature (the thermocouple - thermometer) to compare with the FLIR measurements.
- I made a plot with this data and we can see how temperature vs current behaves.
Note: This data I measured manually.
|
|
|

|