|
ligo-ex
ligo-ds
|
| Richardson Lab Experimental Log |
Not logged in |
 |
|
|
|
Message ID: 88
Entry time: Mon May 1 18:56:57 2023
|
| Author: |
Peter |
| Type: |
Update |
| Category: |
VLC Electronics |
| Subject: |
532nm Intensity Measurement |
|
|
| I've configured the two PDA's to the Red Pitaya. I put a 50 ohm resistor connector to each red pitaya input port. This was because the oscilloscope showed that the voltage reading from the P polarization PDA was almost at 1V, which was the limit of the red pitaya. Once both S and P polarization PDA's were connected, I opened the red pitaya's oscilloscope. A screenshot of the voltage readings is shared below. Channel 1 (Yellow) is for S polarization. Channel 2 (Green) is for P polarization. It would seem that there is a significant amount of polarization in the P direction as opposed to the S direction.
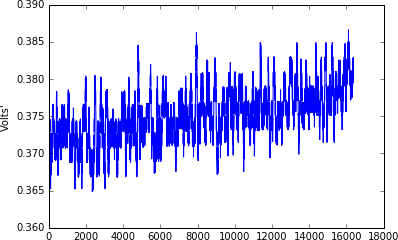
I then tried running the template time series measurement within the python notebook from channel 1 only. The python notebook graph is shown below. I have not figured out what are the units of time on the x axis, and I have not figured out how to change the amount of time that the red pitaya takes data. A plot of the time series measurement is shown below. |
|
|

|