|
ligo-ex
ligo-ds
|
| Richardson Lab Experimental Log |
Not logged in |
 |
|
|
|
Message ID: 207
Entry time: Tue Aug 15 13:32:37 2023
|
| Author: |
Sophia |
| Type: |
Update |
| Category: |
Scripts/Programs |
| Subject: |
Update on Laser Noise Data Collection and Analysis: Dynamic CSD and PSD Plots |
|
|
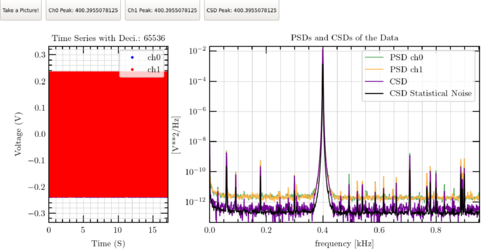
| I have now fixed all issues that I was having this morning, and have added text boxes which show the peak values of both PSD's and the CSD alongside the graphs. They also update continuously with the graph. This is shown in the top image. The laser was driven at 400Hz, and had 0.5V peak to peak voltage, both of which appear correctly in the below graphs.
Now that the code is almost fully working (we will finish debugging the screenshot method later today), our plan tomorrow is to drive the laser and see how the code performs with it. The below graph is from us driving the function generator at 100Hz to test the range.
Update:
Bottom graph is new version of graphs with better distribution of both graphs. |
|

|
|
|