|
ligo-ex
ligo-ds
|
| Richardson Lab Experimental Log |
Not logged in |
 |
|
|
|
Message ID: 194
Entry time: Mon Aug 7 15:36:18 2023
|
| Author: |
Sophia |
| Type: |
Update |
| Category: |
Scripts/Programs |
| Subject: |
Update on Laser Noise Data Collection and Analysis: Dynamic CSD and PSD Plots |
|
|
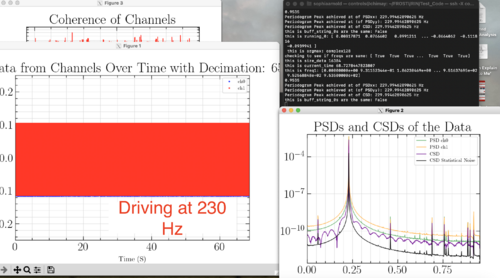
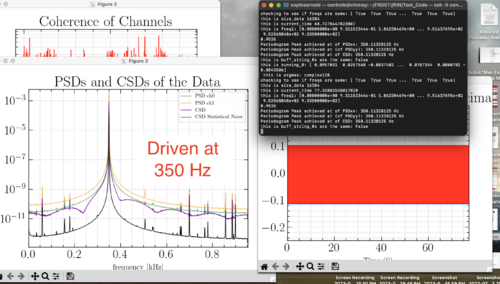
| Today I was able to fix the red pitaya's plotting problem, and get my code to recognize driving frequencies from the function generator to within a 0.5 Hz estimation. The sinusoidal plots I have included are from sending a 1 Hz signal into the red pitaya to see the signal in real time. This allowed me to see exactly where the system was messing up, and fix from the ground up. Once I had that working, I began to test sending in frequencies in the range that my PSD/CSD code could observe and I was able to identify each driving frequency within 0.5 Hz. My code was able to correctly identify a 500 Hz signal, while other analyzed frequencies in the observable range have fallen lower than the sent in frequency by a less than 0.5 Hz. I believe this issue comes from the strange speed that the red pitaya is still acquiring data, even with my fixing it to now observe a continuous signal. |
|
|
|

|
|

|
|
|
|