|
ligo-ex
ligo-ds
|
| Richardson Lab Experimental Log |
Not logged in |
 |
|
|
|
Message ID: 181
Entry time: Fri Jul 28 18:03:07 2023
|
| Author: |
Pamella |
| Type: |
Update |
| Category: |
FLIR |
| Subject: |
Final plot - FLIR |
|
|
[Pamella]
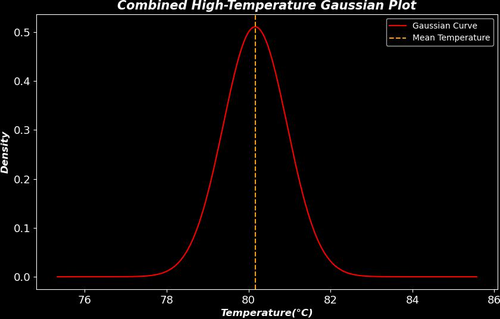
- I was able to plot the final result with the data to the heater. I attached below the "3Combined_HighTemp_Gaussian_Plot." in this plot we can see better behavior on the Gaussian compared to the plot in ELOG 169, I was using the same data but with a different approach. On the ELOG 169, we have the center point isolated data and this new plot is the temperature more than 70 C isolated because we have a very good heater temperature distinguish do background. For the all data I got I was using a power current of 0.20A. To get the data I waited for 30 minutes until the heater became stable and after that, I started to take snaps, I took more than one snap for each one different 6 positions on the screen, and We can see the positions on ELOG 167.
- Also I attached the calibration plot ("calibration_plot") between the measurements with the FLIR camera and thermocouple and we can see looks good if we compare the final plot.
- For better analyses I attached a plot of the calibration line on the Gaussian plot.
- To do: I will finish the final report.
|
|
|

|
|