|
ligo-ex
ligo-ds
|
| Richardson Lab Experimental Log |
Not logged in |
 |
|
|
|
Message ID: 174
Entry time: Thu Jul 27 11:28:36 2023
|
| Author: |
Sophia |
| Type: |
Update |
| Category: |
Scripts/Programs |
| Subject: |
Update on Laser Noise Data Collection and Analysis: Dynamic CSD and PSD Plots |
|
|
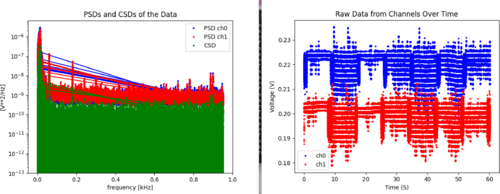
| This week I have successfully been able to implement our dynamic CSD and PSD plotting code, but along the way I encountered a few challenges which I will outline in this elog post.
Challenges:
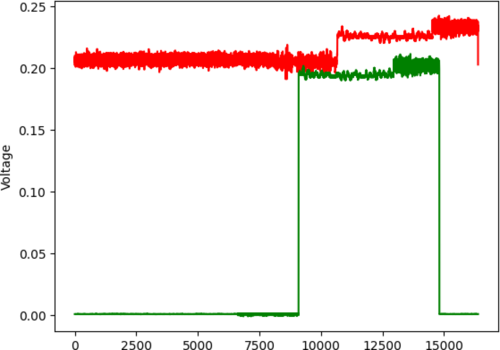
1. Once I was able to plot the data through time, I produced a graph of the raw data (shown below in the top to images) which showed pulsed data instead of a continuous stream. On Tuesday (26th of July) Tyler and I fixed this issue, realizing that calling the starting the trigger in the red pitaya was the issue. When I commented that line of code out, it immediately started plotting continuously.
2. When that issue was solved, We then started having problems with the automatically generated lines in the python program which would double back on each new iteration. I am still dealing with this issue, because the line likes to follow the progression of the data intake instead of through the plot. Currently, I am trying to plot the data as a scatter plot and then add the line as this might make it care only about the data's distribution instead of the order of the points in the list, but I am still unsure. I might try out np.sort (or some equivalent to sort the entire data set before plotting) as well. |
|
|

|
|
|

|