|
ligo-ex
ligo-ds
|
| Richardson Lab Experimental Log |
Not logged in |
 |
|
|
|
Message ID: 167
Entry time: Wed Jul 19 19:10:31 2023
|
| Author: |
Pamella |
| Type: |
Update |
| Category: |
FLIR |
| Subject: |
Data plot FLIR and updates. |
|
|
[Pamella]
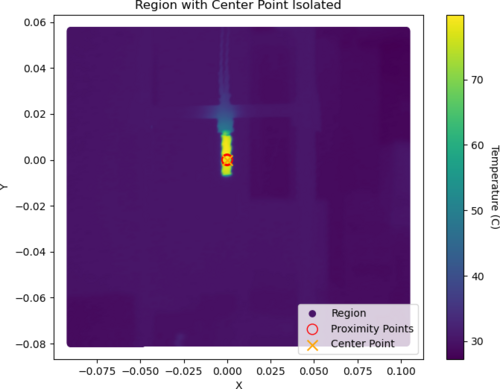
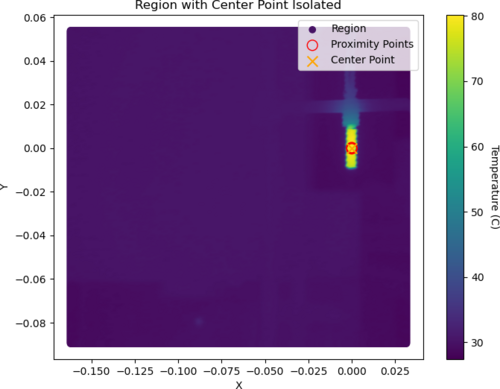
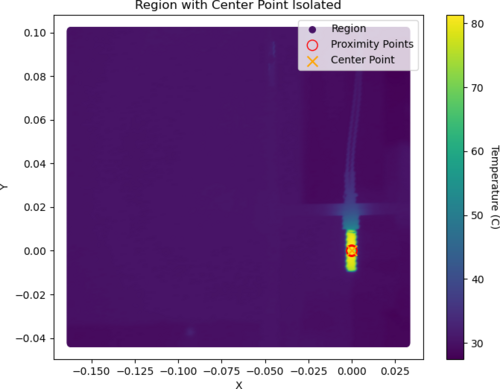
- Today I was able to plot a graph for the isolation point on the center of the heater. I got data from six different positions on the screen (I shifted the all coordinates). I extracted the data for the center point and plot the Gaussian with this extracted data for temperature. I attached the all plots below
- Also I took a snap using the black wall and with the heater at 120.1 C (0.30 A) try to have less noise but
we can see this is not very good. At this temperature, we have noise on the top and I don't understand why because the heater is not in this location. I attached a snap below.
|
|

|
|

|
|
|
|

|
|
|
|