|
ligo-ex
ligo-ds
|
| Richardson Lab Experimental Log |
Not logged in |
 |
|
|
|
Message ID: 162
Entry time: Tue Jul 18 14:13:46 2023
|
| Author: |
Sophia |
| Type: |
Update |
| Category: |
Scripts/Programs |
| Subject: |
Update on Laser Noise Data Collection and Analysis |
|
|
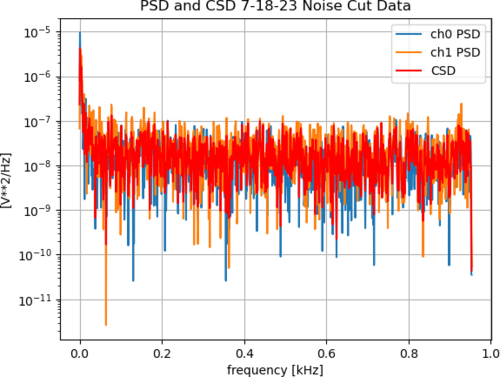
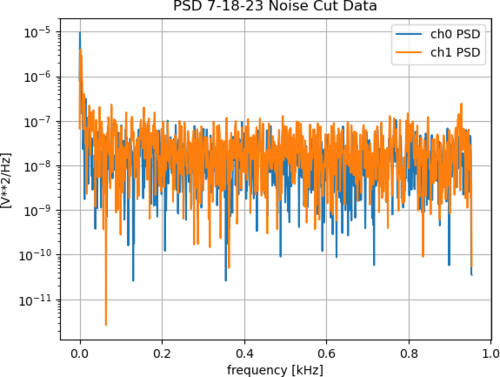
| We [Sophia and Tyler] have found a code which will partition our data and generate PSD's and CSD's automatically. We are now in the stage of writing this into a dynamic code, which so far has been fast-paced because of the framework we have built for it over the past few weeks.
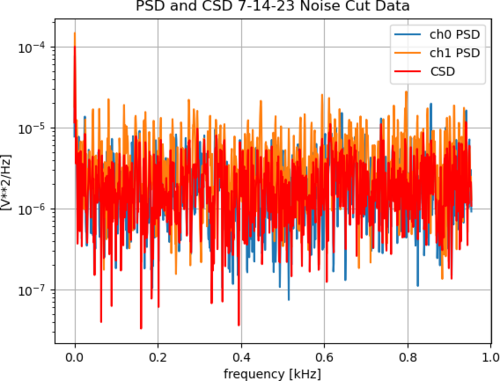
Something to note is that we have found, especially over long periods of time, the laser goes through periods of extreme noise and the signals often cross from where we set them at some point throughout our data collection. We have made the assumption that this is something to do with the laser itself, and not our setup or surrounding space because of both the times that these noise/intensity spikes took place and the duration of the spikes (1.5-2.5 hours). To try and correct for this, we have been "cutting" the noise, and just looking at sections which don't include these big fluctuations. An example of the "noise cut data" is shown in the graph titled "Signals Over Time 7-18-23 Noise Cut Data" and all of the PSD/CSD graphs have been made using only these "noise cut" regions. |
|

|
|
|

|
|
.png.png)
|
|
|

|