|
ligo-ex
ligo-ds
|
| Richardson Lab Experimental Log |
Not logged in |
 |
|
|
|
Message ID: 107
Entry time: Wed May 24 14:28:26 2023
|
| Author: |
Peter |
| Type: |
Update |
| Category: |
VLC Electronics |
| Subject: |
Laser intensity/polarization drift measurements |
|
|
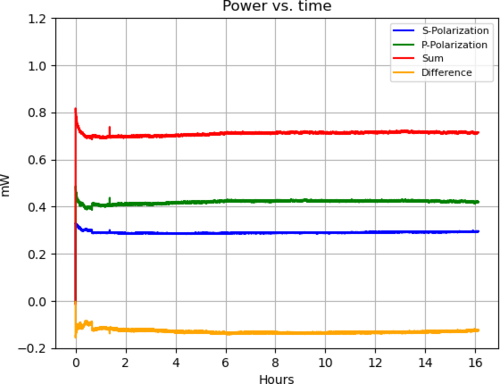
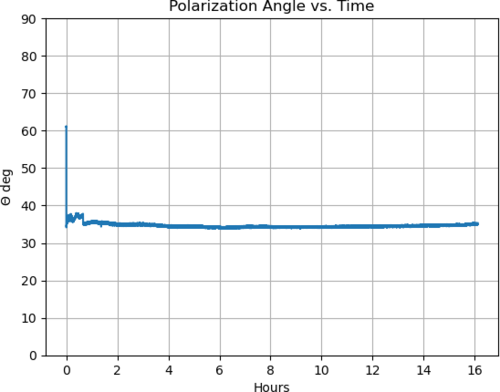
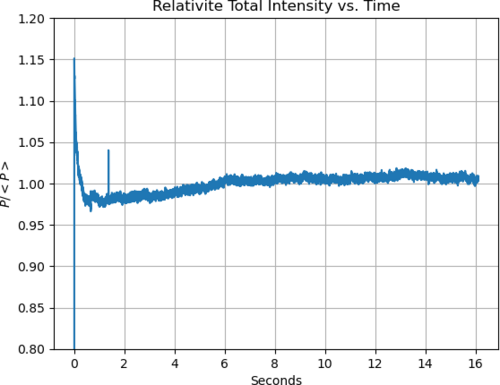
| I went in and took polarization drift data for 16 hours. The run started at 6:08pm and finished at 9:15am the next day. The four plots below are the same plots shown for the 2 hour collection and previous trials, except they extend to 16 hours. The only one that is different is the Power vs. Time graph. This is a graph of the actual incoming power of the laser (as opposed to the signal voltage that the PDA's output into the red pitaya). This was done using the calibration factors of the respective PDA's and as we can see, since there is a difference in the calibration factors between detectors, there is a difference in the power that's coupled into S and P polarization. |
|
|

|
|

|
|

|